Chance Correlation in QSAR studies
220 likes | 419 Vues
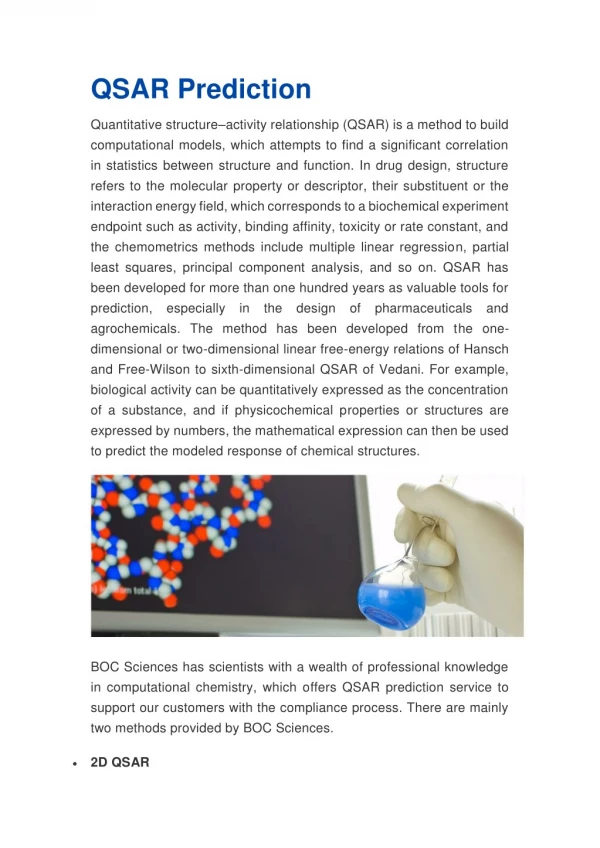
Chance Correlation in QSAR studies. Ahmadreza Mehdipour Medicinal & Natural Product Chemistry Research Center. Correlation or causation?. Correlation is essential but not sufficient Correlation is meaningless unless its cause (or role) in the biological activity is interpreted

Chance Correlation in QSAR studies
E N D
Presentation Transcript
Chance Correlation in QSAR studies Ahmadreza Mehdipour Medicinal & Natural Product Chemistry Research Center
Correlation or causation? • Correlation is essential but not sufficient • Correlation is meaningless unless its cause (or role) in the biological activity is interpreted • A satisfactory QSAR correlation does not mean that a particular descriptor causes the efficient action of a compound
Chance Correlation • Topliss Ratio (J. Med. Chem. 1972, 35, 1066) • A misconception • Ratio of variables in model to Sample Size • Ratio of variables in Data Pool to Sample Size • Revalidation of problem by Livingstone • (J. Med. Chem. 2005, 48, 6661)
Topliss et al. demonstrated that the more independent variables (X) that are available for selection in a multiple linear regression model, the more likely a model will be found by chance. These authors recommended that in order to reduce the risk of chance correlations there should be a certain ratio of data points to the number of independent variables available. Unfortunately, this ratio was often misinterpreted as the number of data points to the number of independent variables in the final model, a practice that did very little if anything to reduce chance effects. D.W. Salt, S. Ajmani, R. Crichton, D.J. Livingstone, An improved approximation to the estimation of the critical F values in best subset regression. J. Chem. Inf. Model. 47 (2007) 143-149.
Chance CorrelationHow does it occur? • A Trial Example with random data • Characteristics: • N (Sample Size)=20 • K (Number of variables in data pool)=10, 20, 50, 75, 100
Avoiding chance correlation What should we do?
Solutions for detection of chance correlation • Fmax critical • Randomization of Y (input scrambling) • Validation procedures
Fmax Critical • Linvingstone Approach • Normal tabulated F is significant ONLY WHEN K=P K= number of variables in data pool P= number of variables in model
Fmax Critical • However, in most cases K>>P K= number of variables in data pool P= number of variables in model N=Sample Size
Introduction of Fmax Critical • Simulated random data • Run 1000 times • Different N, K and P • Obtain Fmax for each combination (for a significance level of 5%) • Check for some Known data sets • www.cmd.port.ac.uk
Randomization of Y • Ys are randomly attributed to samples
Y-randomization However • This method should also be performed during Variable selection process if, R2max and Q2max are low Then, the risk of chance correlation is low
Cross-validation Process • Different N, K, P • N=10, 20, 30, 40, 50, 80, 100 • P=1-8 • N=p, 10, 20, 30, 50, 100 • Run 1000 times • Evaluation factors R2 of training set Q21 = Q2 for LOO CV Q220% = Q2 for Leave-20% of samples-Out CV Q250% = Q2 for Leave-50% of samples-Out CV R2P = R2 of one random test set (25% of samples)
Cross-validation Process • Leave-one-out Vs Leave-group-out • Q2L50%O is independent of N, K, P Hemmateenejad B, Mehdipour AR, Bagheri L, Miri R, Judging the significance of the multiple linear regression-based QSAR models by cross-validation. To be submitted
Concluding Remarks • Be aware of N to K ratio • Not only N to P ratio • Check different approaches for chance correlation
Models are not real but sometimes are helpful