Download
1 / 19
190 likes | 284 Vues
Measurement of the Ultra-peripheral J/psi Cross Section in Au+Au Collisions with the PHENIX Detector. Akihisa Takahara CNS University of Tokyo,RIKEN For THE PHENIX collaboration. Ultra Peripheral Collision.

E N D
Measurement of the Ultra-peripheral J/psi Cross Section in Au+Au Collisions with the PHENIX Detector Akihisa Takahara CNS University of Tokyo,RIKEN For THE PHENIX collaboration ATHIC 2010
Ultra Peripheral Collision relativistic charged particle generates strong electromagnetic field intransverse plane ~ large gamma flux b>2R γ RHIC max. photon energies(EPA): 3 GeV~γ/R γ • Characteristics of UPC • →strong - source • (X) Z2~ 6·103 • () Z4~ 4·107 • @Au(79) • No Nuclear overlap • → low background We can study γγ,γA ,γp interaction without hadronic interaction ATHIC 2010
Motivation to study J/psi in UPC We can see Q2≒2.5, x≒0.01 region by UPC J/psi cross section measurement at RHIC Phys.Rev.C78:044904,2008 Large Uncertainty UPC is good probe to study low x PDF ATHIC 2010
Previous result RHIC average photon energy corresponds to 24GeV PHENIX 2004 • HERA -ZEUS measured γp-> J/psi photo production cross section. • However , In general σ(A)≠σ(p). • PHENIX measured UPC J/psi cross section at 2004. • The result includes all theoretical predictions within 1sigma • Motivation • To improve error to get enough quality to find fittest theoretical predicition -> • 2007 run has 4times statistics ATHIC 2010
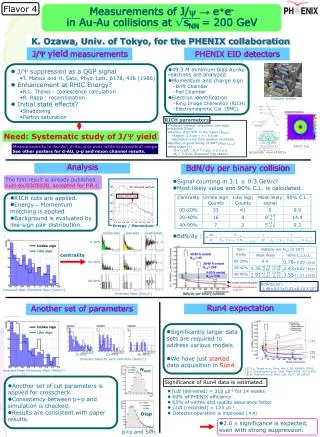
RUN7 central UPC trigger n Coherent UPC: γ+γ→ e+e-, γ+A→ X+J/ψ: lower pt<0.3GeV Incoherent UPC: γ+n → n+J/ψ : wider pt e+ e- Coherent UPC 50-60% ee pairs from UPC J/psi is measured by tagging forward neutron emission UPC trigger BBC detect no charge EMCal energy threshold 1.0GeV 1 or 2 ZDC detects neutron
Background source of UPC J/psi cross section measurement pT^2distribution theoretical • UPC • Incoherent UPC(γ+n→n+J/Ψ):signal • Coherent UPC • γAu→X+J/Ψ:signal • γγ→ee:background • γAu→jet A: • RHIC energy is too lowfor this process Coherent: low pt peak Incoherent: wider pt distribution (Incoherent + neutron tagged : Yellow shadow ) We will see coherent and incoherent J/psi and γγ->ee background. Other physics and non physics background are rejected by UPC trigger. ATHIC 2010
characteristics of continuum and coherent J/psi STARLIGHT model with GEANT simulation • γγ→ee • Low pt peak • Exp fitting • (~exp(-2.1mass)) pT<0.8 Same simulation for coherent UPC J/psi • J/psi • Coherent • Low pt peak • Gaussian fitting Likesign unlikesign ATHIC 2010
Invariant mass • No likesign pair • 43 ee pairs at mee>2GeV • Clear J/psi peak • Clear γγ→ee(Continumm) • Of course we have γγ→ee pair in J/psi region. • To estimate N(J/psi) • Fitting function should be • Gaussian(J/psi) +continuum curve • Continuum shape was estimated by • STARLIGHT simulation with PHENIX detectors and trigger efficiency for electrons NJ/psi:18.75+-5.05(sta)+-0.25(sys) ATHIC 2010
Pair pt • Low J/psi pTpeak • suggest s • coherent UPC • Some higher pT • event s suggests • Incoherent UPC Red cross symbols correspond to this region Simulated data has 1000times larger Statistics. However their Max pT <0.8 At least, their incoherent events We can seeUPC coherent (γAu) &incoherent (γn) J/Ψ production ATHIC 2010
Cross section compared to theoretical calculation Some coherent prediction looks enough to explain the result. However measured pT spectra suggest both coherent and incoherent J/psi production J. Nystrand, Nucl. Phys. A 752(2005)470c; A.J. Baltz, S.R. Klein, J. Nystrand, PRL 89(2002)012301; S.R. Klein, J. Nystrand, Phys. Rev. C 60(1999)014903 M. Strikman, M. Tverskoy and M. Zhalov, Phys. Lett. B 626 72 (2005) V. P. Goncalves and M. V. T. Machado, arXiv:0706.2810 (2007). Yu. P. Ivanov, B. Z. Kopeliovich and I. Schmidt, arXiv:0706.1532 (2007). Run7:54.1±14.6 +10.3/-9.7μb Run4(published data):76±31(stat)±11(sys) μb Run 4& 7 combined 60.8±13.7(stat)+10.5−10.1(sys) μb. ATHIC 2010
Cross section compared to theoreticalcalculations(coh +incoh) Run7:54.1±14.6 +10.3/-9.7μb Run4(published data):76±31(stat)±11(sys) μb • Run7 result is lower than run4 • Relatively , half statistical error • Statistical error is close enough • systematical error . At 2010 run analysis, • we need to improve systematical error. ATHIC 2010
2004-2007 combined result Run 4& 7 combined 60.8±13.7(stat)+10.5−10.1(sys) μb. • Compared to statistical error • Strikman: • Color dipole model • Impluse or glauber approximation • +0.47- -0.62sigma • Kopeliovich: • Color dipole model+ • gluon saturation effects • KST or GBW parameterization • +1.78- +1.05sigma 1.2<|y|< 2.4 covered by PHENIX muon arm, and we have taken data at RUN 10 &7. Muon UPC will be analyzed Strikman looks better ATHIC 2010
Comparison with HERA data HERA data; Please note this calculation is just a trial. We don’t have enough statistic to separate coherent and incoherent Alpha=1Hard probe scaling Alpha=2/3 Soft probe scaling ATHIC 2010
Summary and outlook Summary • 2007 neutron tagged UPC J/psi cross section is 54.1±14.6 +10.3/-9.7μb • Combined cross section is 60.8±13.7(stat)+10.5−10.1(sys) μb. • Lower statistical error . Now it equal to systematic error. • Good agreement with theoretical calculations. Especially, Strikman result. • pT distribution shows both coherent and incoherent process. Outlook • 2010 forward UPC(μμ) will be analyzed • future eRHIC & LHC programs. ATHIC 2010
Back up ATHIC 2010
The experimental signaturesand the analysis • Analysis cut • Vertex cut:|Zvertex|<30cm • ZDC north || south>30GeV • Number of electron candidate • tracks==2 • No real track other than • 2 electron candidate tracks. • BBC veto(offline) • Electron(positron) id • RICH associated • Emcal matching • UPC signatures • Only e+ e- pair in central arm • At least 1 neutron ATHIC 2010
UPC measurement in PHENIX(at 2007) n e+ e- Coherent UPC 50-60% • UPC trigger • No MB trigger:BBC VETO • 1 or 2 neutron :ZDC • Emcal (>1GeV) • ee pair • DC and PC, tracking • RICH and Emcal, e id ATHIC 2010
RHIC and PHENIX • Relativistic Heavy Ion Collider, • at the Brookhaven National • Laboratory (NY,USA) • About 4km circumference • (Second largest of Ion collider) • Center of mass energy per nucleons • ~200GeV(AuAu),~500GeV(pp) • AuAu, pp, d+Au,CuCu • 2007-RUN • AuAu • “200GeV • Integrated Luminosity is4 times larger than last 2004 AuAu run ATHIC 2010