Analysis of d13C Spectra and Hydrogen Protons in Complex Molecular Structures
This document presents a detailed analysis of complex d13C spectra in various molecular configurations, focusing on the peaks observed in the 1H NMR spectra. Key peaks include d13C values at 9.24 ppm, 117.80 ppm, and 134.90 ppm, amongst others, alongside comparative studies of related molecular structures. The data provides insights into the complexities of molecular interactions and assists in understanding the hydrogen bonding environment. Both free and complexed forms of d13C are analyzed for their significance in chemical dynamics.

Analysis of d13C Spectra and Hydrogen Protons in Complex Molecular Structures
E N D
Presentation Transcript
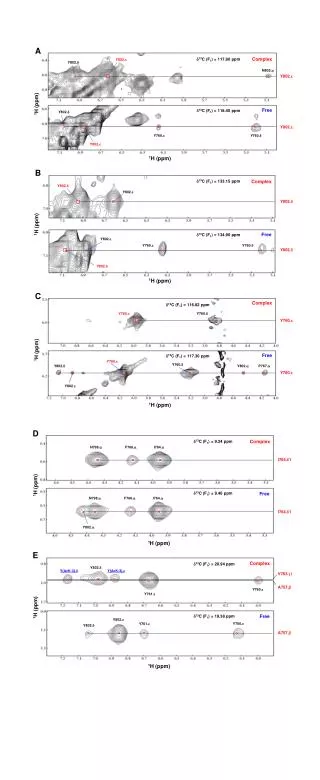
D E d13C (F1) = 9.24 ppm Complex Complex d13C (F1) = 117.80 ppm Y802.e Y802.d N798.a F766.a I764.a N803.a Y802.e I764.d1 1H (ppm) 1H (ppm) Free d13C (F1) = 118.40 ppm d13C (F1) = 9.46 ppm Free Y802.d N798.a F766.a I764.a Y802.e I764.d1 Y760.e Y760.d Y802.e Y802.a 1H (ppm) 1H (ppm) d13C (F1) = 133.15 ppm Complex Y802.d Complex d13C (F1) = 20.94 ppm Y802.e Y802.d Y(AcK-3).d Y(AcK-3).e V763.g1 Y802.d A757.b Y760.e Y761.e 1H (ppm) 1H (ppm) Free d13C (F1) = 134.90 ppm Y802.e Free d13C (F1) = 19.38 ppm Y760.e Y760.d Y802.e Y802.d Y760.e Y761.e Y802.d A757.b Y802.d 1H (ppm) 1H (ppm) Complex d13C (F1) = 116.82 ppm Y760.e Y760.d Y760.e 1H (ppm) Free d13C (F1) = 117.30 ppm Y760.e Y760.d Y802.d Y802.a P767.a Y760.e Y802.e 1H (ppm) A B C