
Figure 1. Forest plot presenting the weighted mean difference on the IIEF erectile function domain final score of trials comparing sildenafil versus placebo.

E N D
Presentation Transcript
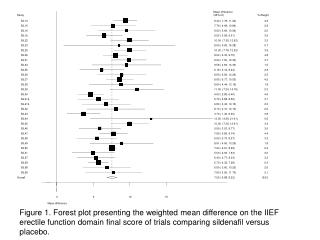
Figure 1. Forest plot presenting the weighted mean difference on the IIEF erectile function domain final score of trials comparing sildenafil versus placebo.
Figure 2. Forest plot presenting the weighted mean difference on the IIEF erectile function domain final score of trials comparing vardenafil versus placebo.
Figure 3. Forest plot presenting the weighted mean difference on the IIEF erectile function domain final score of trials comparing tadalafil versus placebo.
Figure 4. Forest plot presenting the odds ratio of the general efficacy question ‘Improved erections’ of trials comparing sildenafil versus placebo
Figure 5. Forest plot presenting the odds ratio of the general efficacy question ‘Improved erections’ of trials comparing vardenafil versus placebo
Figure 6. Forest plot presenting the odds ratio of the general efficacy question ‘Improved erections’ of trials comparing tadalafil versus placebo
Figure. 7 Funnel plot presenting the weighted mean difference on the IIEF erectile function domain final score against size of studies (as standard error of weighted mean difference) of trials comparing sildenafil versus placebo
Figure 8 Funnel plot presenting the weighted mean difference on the IIEF erectile function domain final score against size of studies (as standard error of weighted mean difference) of trials comparing vardenafil versus placebo
Figure 9. Funnel plot presenting the weighted mean difference on the IIEF erectile function domain final score against size of studies (as standard error of weighted mean difference) of trials comparing tadalafil versus placebo
Figure 10. Funnel plot presenting the log odds ratio of the GEQ against size of studies (as standard error of the log odds ratio) of trials comparing sildenafil versus placebo
Figure 11. Funnel plot presenting the log odds ratio of the GEQ against size of studies (as standard error of the log odds ratio) of trials comparing vardenafil versus placebo
Figure 12. Funnel plot presenting the log odds ratio of the GEQ against size of studies (as standard error of the log odds ratio) of trials comparing tadalafil versus placebo