Download
1 / 34
340 likes | 430 Vues
Explore the evolution of data analysis in experimental physics, from intelligent detectors to optimal multivariate methods and probabilistic approaches at ACAT2000. Pushpa Bhat presents innovative ways to transform data into meaningful insights.

E N D
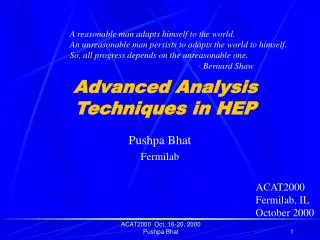
Advanced Analysis Techniques in HEP A reasonable man adapts himself to the world. An unreasonable man persists to adapts the world to himself. So, all progress depends on the unreasonable one. - Bernard Shaw Pushpa Bhat Fermilab ACAT2000 Fermilab, IL October 2000 ACAT2000 Oct. 16-20, 2000 Pushpa Bhat
Outline • Introduction • Intelligent Detectors • Moving intelligence closer to action • Optimal Analysis Methods • The Neural Network Revolution • New Searches & Precision Measurements • Discovery reach for the Higgs Boson • Measuring Top quark mass, Higgs mass • Sophisticated Approaches • Probabilistic Approach to Data Analysis • Summary ACAT2000 Oct. 16-20, 2000 Pushpa Bhat
World before Experiment World After Experiment Express Analysis Data Collection Data Transformation Data Interpretation Feature Extraction Global Decision Data Collection Data Organization Reduction Analysis ACAT2000 Oct. 16-20, 2000 Pushpa Bhat
Intelligent Detectors • Data analysis starts when a high energy event occurs • Transform electronic data into useful “physics” information in real-time • Move intelligence closer to action! • Algorithm-specific hardware • Neural Networks in Silicon • Configurable hardware • FPGAs, DSPs – Implement “smart” algorithms in hardware • Innovative data management on-line + “smart” algorithms in hardware • Data in RAM disk & AI algorithms in FPGAs • Expert Systems for Control & Monitoring ACAT2000 Oct. 16-20, 2000 Pushpa Bhat
Data Analysis Tasks • Particle Identification • e-ID, t-ID, b-ID, e/g, q/g • Signal/Background Event Classification • Signals of new physics are rare and small (Finding a “jewel” in a hay-stack) • Parameter Estimation • t mass, H mass, track parameters, for example • Function Approximation • Correction functions, tag rates, fake rates • Data Exploration • Knowledge Discovery via data-mining • Data-driven extraction of information, latent structure analysis ACAT2000 Oct. 16-20, 2000 Pushpa Bhat
Optimal Analysis Methods • The measurements being multivariate, the optimal methods of analyses are necessarily multivariate • Discriminant Analysis: Partition multidimensional variable space, identify boundaries • Cluster Analysis: Assign objects to groups based on similarity • Examples • Fisher linear discriminant, Gaussian classifier • Kernel-based methods, K-nearest neighbor (clustering) methods • Adaptive/AI methods ACAT2000 Oct. 16-20, 2000 Pushpa Bhat
x1 D(x1,x2)=2.014x1 + 1.592x2 x2 x2 x1 Why Multivariate Methods? • Because they are optimal! ACAT2000 Oct. 16-20, 2000 Pushpa Bhat
Mth Order Polynomial Fit M=1 M=3 M=10 x2 x2 x2 x1 x1 x1 • Also, they need to have optimal flexibility/complexity Flexible Highly flexible Simple ACAT2000 Oct. 16-20, 2000 Pushpa Bhat
The Golden Rule Keep it simple As simple as possible Not any simpler - Einstein ACAT2000 Oct. 16-20, 2000 Pushpa Bhat
Optimal Event Selection defines decision boundaries that minimize the probability of misclassification Posterior probability So, the problem mathematically reduces to that of calculating r(x), the Bayes Discriminant Function or probability densities ACAT2000 Oct. 16-20, 2000 Pushpa Bhat
Probability Density Estimators • Histogramming: The basic problem of non-parametric density estimation is very simple! • Histogram data in M bins in each of the d feature variables • Md bins Curse Of Dimensionality • In high dimensions, we would either require a huge number of data points or most of the bins would be empty leading to an estimated density of zero. • But, the variables are generally correlated and hence tend to be restricted to a sub-space Intrinsic Dimensionality ACAT2000 Oct. 16-20, 2000 Pushpa Bhat
Kernel-Based Methods • Akin to Histogramming but adopts importance sampling • Place in d-dimensional space a hypercube of side h centered on each data point x, The estimate will have discontinuities Can be smoothed out using different forms for kernel functions H(u). A common choice is a multivariate kernel N = Number of data points H(u) = 1 if xn in the hypercube = 0 otherwise h=smoothing parameter ACAT2000 Oct. 16-20, 2000 Pushpa Bhat
K nearest-neighbor Method • Place a hyper-sphere centered at each data point x and allow the radius to grow to a volume V until it contains K data points. Then, density at x • If our data set contains Nk points in class Ck and N points in total, then N = Number of data points Kk = # of points in volume V for class Ck ACAT2000 Oct. 16-20, 2000 Pushpa Bhat
Discriminant Approximation with Neural Networks Output of a feed forward neural network can approximate the Bayesian posterior probability p(s|x,y) Directly without estimating class-conditional probabilities ACAT2000 Oct. 16-20, 2000 Pushpa Bhat
Calculating the Discriminant Consider the sum Where di = 1 for signal = 0 for background = vector of parameters Then in the limit of large data samples and provided that the function n(x,y,) is flexible enough. ACAT2000 Oct. 16-20, 2000 Pushpa Bhat
x1 x2 DNN x3 x4 Neural Networks • NN estimates a mapping function without requiring a mathematical description of how the output formally depends on the input. • The “hidden” transformation functions, g, adapt themselves to the data as part of the training process. The number of such functions need to grow only as the complexity of the problem grows. ACAT2000 Oct. 16-20, 2000 Pushpa Bhat
Measuring the Top Quark Mass Discriminant variables shaded = top The Discriminants ACAT2000 Oct. 16-20, 2000 Pushpa Bhat
Measuring the Top Quark Mass Background-rich DØ Lepton+jets Signal-rich mt = 173.3 ± 5.6(stat.) ± 6.2 (syst.) GeV/c2 ACAT2000 Oct. 16-20, 2000 Pushpa Bhat
Strategy for Discovering the Higgs Boson at the Tevatron P.C. Bhat, R. Gilmartin, H. Prosper, PRD 62 (2000) hep-ph/0001152
MH = GeV/c2MH < 225 GeV/c2 at 95% C.L. Hints from the Analysis of Precision Data LEP Electroweak Group, http://www.cern.ch/LEPEWWG/plots/summer99 ACAT2000 Oct. 16-20, 2000 Pushpa Bhat
Event Simulation • Signal Processes • Backgrounds • Event generation • WH, ZH, ZZ and Top with PYTHIA • Wbb, Zbb with CompHEP, fragmentation with PYTHIA • Detector modeling • SHW (http://www.physics.rutgers.edu/~jconway/soft/shw/shw.html) • Trigger, Tracking, Jet-finding • b-tagging (double b-tag efficiency ~ 45%) • Di-jet mass resolution ~ 14% • (Scaled down to 10% for RunII Higgs Studies) ACAT2000 Oct. 16-20, 2000 Pushpa Bhat
WH Results from NN Analysis MH = 100 GeV/c2 WH vs Wbb WH ACAT2000 Oct. 16-20, 2000 Pushpa Bhat
WH (110 GeV/c2)NN Distributions ACAT2000 Oct. 16-20, 2000 Pushpa Bhat
Results, Standard vs. NN A good chance of discovery up to MH= 130 GeV/c2 with 20-30fb-1 ACAT2000 Oct. 16-20, 2000 Pushpa Bhat
Improving the Higgs Mass Resolution Use mjj and HT (= Etjets ) to train NNs to predict the Higgs boson mass 13.8% 12.2% 13.1% 11..3% 13% 11% ACAT2000 Oct. 16-20, 2000 Pushpa Bhat
Newer ApproachesEnsembles of Networks • Committees of Networks • Performance can be better than the best single network • Stacks of Networks • Control both bias and variance • Mixture of Experts • Decompose complex problems ACAT2000 Oct. 16-20, 2000 Pushpa Bhat
Exploring Models:Bayesian Approach • Provides probabilistic information on each parameter of a model (SUSY, for example) via marginalization over other parameters • Bayesian method enables straight-forward and meaningful model comparisons. It also allows treatment of all uncertainties in a consistent manner. • Mathematically linked to adaptive algorithms such as Neural Networks (NN) • Hybrid methods involving NN for probability density estimation and Bayesian treatement can be very powerful ACAT2000 Oct. 16-20, 2000 Pushpa Bhat
Summary • We are building very sophisticated equipment and will record unprecedented amounts of data in the coming decade • Use of advanced “optimal” analysis techniques will be crucial to achieve the physics goals • Multivariate methods, particularly Neural Network techniques, have already made impact on discoveries and precision measurements and will be the methods of choice in future analyses • Hybrid methods combining “intelligent” algorithms and probabilistic approach will be the wave of the future ACAT2000 Oct. 16-20, 2000 Pushpa Bhat
r(x,y) = constant defines an optimal decision boundary Feature space Optimal Event Selection S = B = Conventional cuts ACAT2000 Oct. 16-20, 2000 Pushpa Bhat
Probabilistic Approach to Data Analysis (The Wave of the future) Bayesian Methods
Bayesian Analysis Posterior Likelihood Prior M model A uninteresting parameters p interesting parameters d data Bayesian Analysis of Multi-source Data P.C. Bhat, H. Prosper, S. Snyder, Phys. Lett. B 407(1997) 73 ACAT2000 Oct. 16-20, 2000 Pushpa Bhat
Higgs Mass Fits S=80 WH events, assume background distribution described by Wbb. Results S/B = 1/10 Mfit= 114 +/- 11GeV/c2 S/B = 1/5 Mfit= 114 +/- 7GeV/c2 ACAT2000 Oct. 16-20, 2000 Pushpa Bhat