Download
1 / 14
140 likes | 251 Vues
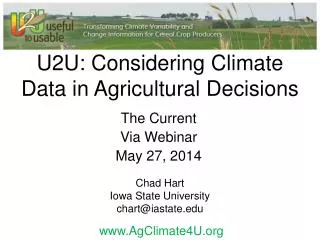
U2U: Considering Climate Data in Agricultural Decisions. The Current Via Webinar May 27, 2014. Chad Hart Iowa State University chart@iastate.edu. www.AgClimate4U.org. Decision Dashboard. AgClimate View. Plot local temperature and precipitation variation as far back as 1980,

E N D
U2U: Considering Climate Data in Agricultural Decisions The Current Via Webinar May 27, 2014 Chad Hart Iowa State University chart@iastate.edu
AgClimate View • Plot local temperature and precipitation variation as far back as 1980, • Track county crop yields and trends, and • Consider crop yields in the context of temperature, precipitation, and growing degree day data • Used in tandem with other decision resources, AgClimate View can help you find long-term correlations between climate trends and yields, while helping you put your recent crop experience into historical context.
Corn Growing Degree Days • This tool puts current conditions into a 30-year historical perspective and offers trend projections through the end of the calendar year. GDD projections, combined with analysis of historical analog data, can help you make decisions about: • Climate Risks – Identify the likelihood of early and late frosts/freezes. • Activity Planning – Consider corn hybrid estimated physiological maturity requirements, along with GDD projections when making seed purchasing and other growing season decisions. • Marketing – Look at historical and projected GDD when considering forward pricing and crop insurance purchases.
Probable Fieldwork Days • This spreadsheet-based tool uses historical “Days Suitable for Fieldwork”, as computed by USDA, to determine the probability of completing in-field activities in a given time period. This tool explores: • Short-term Weather Risks – Quantifies historical risk of weather-related agricultural delays. • Activity Planning – Evaluates the potential to complete fieldwork with current equipment in a timely fashion.
List of Future Tools • In-season Nitrogen Application • A tool to evaluate the potential for in-season fertilizer application • Examines time needed for application • Incorporates yield benefit from application and/or penalty for non-application • Climate Patterns • A tool to show the monthly impacts from the El Niño Southern Oscillation (ENSO) and Arctic Oscillation (AO) by regions in a state. • Provides average monthly precipitation and temperature, along with deviations from normal by phase (El Niño, La Niña, etc.)