Download
1 / 26
260 likes | 359 Vues
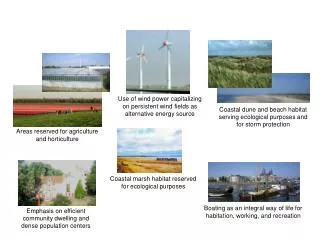
This study explores mesoscale wind power modelling over Europe, analyzing correlations and spatial smoothing effects for onshore and offshore wind power. The findings suggest potential spatial smoothing effects and the importance of an On+Offshore SuperGrid for large-scale wind power integration.

E N D
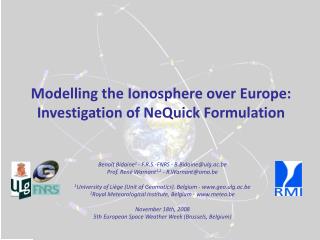
Modelling of Wind Speed Fields over Europe and Power Correlations in a 400 GW Scenario Jens Tambke, Lueder von Bremen, Michael Schmidt, Gerald Steinfeld, Jörg-Olaf Wolff ForWind & ICBM / Universität Oldenburg Frans Van Hulle XPwind, Belgium
Overview • Grid Design in the IEE-study „OffshoreGrid“ • Mesoscale Wind Power Modelling • Fluctuations and Pan-European Wind Power Correlations
Meso-scale Model: WRF [m/s] FNL initialization 2-domain-setup, one-way-nesting 1st domain resolution: 27x27 km² 2nddomainresolution: 9x9 km² WRF-speeds [m/s] at 90m averages in 2007
Meso-scale Errors at FINO1 FINO1, alpha ventus Mean Wind Speeds at 100m: ~10m/s Mean Potential Power Production: ~50% of the installed Capacity
Spatial Smoothing Effects Belgium / Mid-West EU / EU+No+CH slide 6
Total European On&Offshore Power 2030:267 GW inst. Onshore - mean production: 64 GW 127 GW inst. Offshore - mean theoret. prod.: 66 GW [GigaWatt] Total Sum Time in the Year [h]
SpatialSmoothingEffects Correlationwithreal German Wind Power Generation von-Bremen-Map winter
von-Bremen-Map CorrelationwithEU Offshore Wind Power winter slide 9
von-Bremen-Map Correlationwith EU Onshore Wind Power winter
von-Bremen-Map Correlationwithtotal EU On+Offshore Wind Power winter
von-Bremen-Map CorrelationwithEU Offshore WindPower whole year
von-Bremen-Map CorrelationwithEU OnshoreWind Power whole year
von-Bremen-Map CorrelationwithEU total On+OffshoreWind Power slide 14
Spatial Smoothing Effects 1-hour Power Gradients
consumption anomaly [GW] (mean=357GW) Monthly Solar & Wind Generation & LoadFluctuations in Europe PV WindLastanomalie Source: L.von Bremen et al. Proc. 8th Int. Offshore Integration Workshop (Ackermann Workshop), Bremen 2009
„Optimal Mix“ of Solar and Wind for a 100% Supply Source: L.von Bremen et al. Proc. 8th Int. Offshore Integration Workshop (Ackermann Workshop), Bremen 2009
Conclusions • Meso-scale simulations exhibit stronger variability of regional power than former studies using only global-scale analysis • Large-scale wind power integration (e.g. 80%) will be much easier with an On+Offshore SuperGrid to smooth variability www.OffshoreGrid.eu www.SafeWind.eu jens.tambke@forwind.de
Meso-scale Model WRF WRF model: NCEP initialization 2-domain-setup, one-way-nesting 1st domain resolution: 27x27 km² 2nd domain resolution: 9x9 km²
Speeds in Storm „Kyrill“, Jan‘07 [m/s] Hourly WRF-wind speeds [m/s] at 90m height
European On&Offshore Power Power [GW] June 2030 Hour of the Year
unstable -0.6 < 10m/L < +0.6 stable 10m/L -0.6 -0.3 0 +0.3 +0.6 WRF Wind Speed Profiles & Thermal Stratification Profiles are bin-averaged between very unstable (convective) situations and very stable stratification: -0.6 < 10m/L < +0.6, where L is the Monin-Obukhov-Length
WRF DWD-LME Observation for wind directions between 190° and 250° Mean Wind Profiles at FINO1
WRF Speed Ratio u90./u30 vs. 10m/L Monin-Obukhov Obs. WRF Slide 26