Flash Flood Forecasting
Flash Flood Forecasting. Discussion for Wall to Wall TV 22 July 1999 Matt Kelsch with Greg Byrd Patrick Dills Steve Drake Katy Ginger Craig Hartsough Bob Henson Delores Kiessling Liz Page Pete Stamus Doug Wesley. FLASH FLOODS Precipitation Precipitation Hydrologic


Flash Flood Forecasting
E N D
Presentation Transcript
Flash Flood Forecasting Discussion for Wall to Wall TV 22 July 1999 Matt Kelsch with Greg Byrd Patrick Dills Steve Drake Katy Ginger Craig Hartsough Bob Henson Delores Kiessling Liz Page Pete Stamus Doug Wesley
FLASH FLOODS Precipitation Precipitation Hydrologic Duration Intensity Aspects
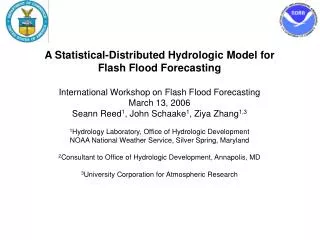
H L L L IDEALIZED SURFACE PATTERN Cells develop east of highest terrain* Cells then move slowly north and northwest* Redevelopment occurs on SE or S flank* Heaviest rain falls over a very small area LOW LEVEL JET AND MOISTURE TONGUE THREAT AREA 500 MB TROF Td$65oF LOW LEVEL T-Td#6oC THERMAL AXIS ADOPTED FROM MADDOX ET AL., 1977
L 312 315 315 0oC 2oC H -2oC 8o 4oC 6oC L Td 315 Southwest, blocking high type heavy rainfall event. Note that the high center shifts east of 4-corners. This allows moisture to be pulled northward from the Gulf of CA. 576 14 582 582 12 10 10 588 T-Td#6oC 08 TROF H 06 06 TROF L 588 10 08 500 HEIGHTS AND VORTICITY 700 MB COMPOSITE Note there is often a upper low to the southwest with a vorticity lobe extending towards the threat area. These features often show up best on water vapor imagery.
1016 1012 1010 1010 1012 50o 50o 1016 60o 1012 65o 60o 1012 1008 65o 1008 An old front/surface boundary and weak mean flow are usually present -33 300 9 PW=1.15” (160% OF NORMAL) -8 500 5 RH=66% LI=-2 10 700 8 KI=35 1010.7 8159 SFC
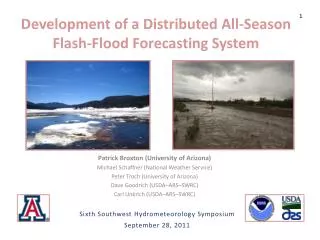
U.S. Desert Southwest Flash Floods of July 1999 • Learning objectives • understand the ingredients that produce desert flash floods • understand the role of terrain in the Las Vegas valley. • recognize the characteristics of efficient precipitation production • Assignment, Part I: set the AWIPS clock to 1200 UTC 8 July 1999. • Look at the data including NOWRAD and 12Z model runs. • On the map of the area, where will the most rainfall be in the 12-hour period ending 0000 UTC 9 July? Hand in for compilation.
U.S. Desert Southwest Flash Floods of July 1999 • Assignment Part II: set the AWIPS clock to 1930 UTC 8 July 1999. The Las Vegas radar is KESX. • What seems to be focusing the storm cells between 1800 and 1930? • Are there signs of particularly efficient precipitation production and enhanced rainfall rate (low centroids, minimal lightning, tropical-like environment)? • Assignment, Part III: set the AWIPS clock to 0100 UTC 9 July 1999. • Look at the storm total precipitation from kesx. What role did terrain seems to play? • Look at the ETA 0000 UTC model run. Where is the “easterly wave” disturbance at the 48h forecast (0000 UTC 11 July 1999)? Where might the heaviest precipitation be focused on 11 July?