Download
1 / 34
340 likes | 516 Vues
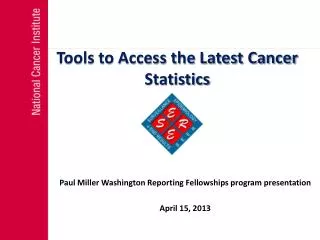
Tools to Access the Latest Cancer Statistics. Paul Miller Washington Reporting Fellowships program presentation April 15, 2013. Surveillance, Epidemiology, and End Results (SEER) Program: Cancer Registries and Collaborators. SEER area, funded by NCI. SEER/NPCR* area, funded by NCI and CDC.

E N D
Tools to Access the Latest Cancer Statistics Paul Miller Washington Reporting Fellowships program presentation April 15, 2013
Surveillance, Epidemiology, and End Results (SEER) Program: Cancer Registries and Collaborators SEER area, funded by NCI SEER/NPCR* area, funded by NCI and CDC NPCR area, funded by CDC *NPCR – National Program of Cancer Registries
The SEER Program • SEER collects data on cancer incidence and survival, calculates prevalence, and compiles these statistics, plus also reports mortality data. • NCI’s Surveillance Research Program (SRP) reports data collected by SEER in the Cancer Statistics Review and other publications made available to reporters and the public. It is usually updated every April 15. This year’s update will cover the period from 1975-2010 • Data is also available through SEER tools and resources, such as SEER*Stat software and linked data files. Requests are hand-processed.
Annual Report to the Nation on the Status of Cancer • NCI partners on the “The Annual Report to the Nation on the Status of Cancer” with CDC, the American Cancer Society, and the North American Association of Central Cancer Registries. • The most recent Annual Report to the Nation appeared in JNCI on Jan. 7, 2013, with a special section on Human Papilloma Virus (HPV) surveillance. • The next Annual Report, covering the time period 1975-2010, should appear early in 2014.
SEER Cancer Stat Fact Sheet Cancer Stat Fact Sheets provide statistical summaries for 30 cancer sites, including for “All Cancer Sites.” seer.cancer.gov/statfacts/
Cancer Stat Fact Sheet: All Cancer Sites • For each fact sheet, statistics may • include Incidence & Mortality, Survival, • Lifetime Risk, and Prevalence. • These are updated annually to coincide • with SEER data release.
Cancer Stat Fact Sheet: All Cancer SitesSEER Incidence • SEER Incidence • Incidence is the number of new cases of disease • diagnosed each year. • The “age-adjusted” incidence rate for All Cancer • Sites was 465.2 per 100,000 people per year. • This is based on cases diagnosed in 2005-2009 • from 18 SEER geographic areas.
Cancer Stat Fact Sheet: All Cancer SitesUS Mortality • US Mortality • US mortality is the number of deaths in a certain • group of people in a certain period of time. • The “age-adjusted” death rate for All Cancer Sites • was 178.7 per 100,000 people per year. • This rate is based on patients who died in 2005- • 2009 in the United States.
Cancer Stat Fact Sheet: All Cancer SitesTrends in Rates • Trends in SEER Incidence Rates • Trends can be evaluated by the annual percent change (APC). • From 1998 to 2009 the APC for All Cancer Sites • was -0.5. This was a statistically significant decrease. • Joinpointanalyses are used to evaluate when changes in the trend occurred with the APC.
Joinpoint Trends in SEER Incidence Rates, 1975-2009All Cancer Sites • Joinpoint Trend in SEER Cancer Incidence • An asterisk after the APC indicates that the • trend was statistically significant. • Negative estimate indicates that cancer • incidence was decreasing in that time period.
Cancer Stat Fact Sheet: All Cancer SitesSurvival • Survival • These survival statistics are based on 5-year • Relative Survival. Relative survival estimates • the percentage of patients expected to survive • their cancer at a least 5 years after diagnosis. • The overall 5-year relative survival rate for men • and women was 65.4%. • This is based on cases diagnosed between • 2002-2008 from 18 SEER geographic areas.
Cancer Stat Fact Sheet: All Cancer SitesLifetime Risk • Lifetime Risk • Lifetime Risk is an estimate of the percentage of • patients who will be diagnosed with cancer in their • lifetime. • Based on rates from 2007-2009, 41.2% of men and • women born today will be diagnosed with cancer in • their lifetime. • SEER also calculates the probability of developing • cancer between two age groups. This is available in Fast • Stats.
Cancer Stat Fact Sheet: All Cancer SitesPrevalence • Prevalence • Prevalence is the number of people alive that have had a previous diagnosis of cancer. • On January 1, 2009, there were 12,553,337 men and • women alive who had a history of cancer of all sites.
Trends in SEER Incidence by Primary Cancer Site, 2000-2009 Average Annual Percent Change 2000-2009 * The APC is significantly different from zero (p<.05)
Trends in US Death Rates by Primary Cancer Site, 2000-2009 Average Annual Percent Change 2000-2009 * The APC is significantly different from zero (p<.05)
SEER Web Sites • SEER Home Page (http://seer.cancer.gov/) • Cancer Statistics (http://seer.cancer.gov/statistics/) • Fact Sheets • Cancer Statistics Review (CSR) • State Cancer Profiles • Access to SEER Datasets and NCI Software to analyze data (http://seer.cancer.gov/resources/)
What is State Cancer Profiles? • Statistics for prioritizing cancer control activities • National, state, and local level data • Collaboration • CDC’s National Program of Cancer Registries (NPCR) • NCI’s Surveillance, Epidemiology and End Results Registries (SEER)
Available Data • Cancer incidence, mortality data and prevalence data • Latest data years currently available • 2009 NCI SEER incidence (2010 coming soon) • 2009 CDC NPCR incidence • 2009 NCHS mortality • About 20 different cancer sites • Screening and risk factor data
State Cancer Profiles Usage Resource for: • Priority setting; planning • Implementing and assessing cancer control projects • Exposing health disparities • Comparing state cancer data with other states • Reviewing trends in cancer • Presentations, reports, proposals, training
Quick Profiles Support Data
Population: Age Groups • Population: Race Groups • Education • Income • Housing • Urban/Rural • Workforce: Unemployed • Poverty Demographic Data
Coming Soon to State Cancer Profiles • Home Page • HINTS (Health Interview National Trends Survey) • Demographic data • Small Area Health Insurance Estimates
Please visit: www.cancer.gov Questions