Track Finder Visualization
This tool allows users to "step through" an algorithm, displaying information at each step. It helps visualize how changes in the algorithm affect various aspects of it.

Track Finder Visualization
E N D
Presentation Transcript
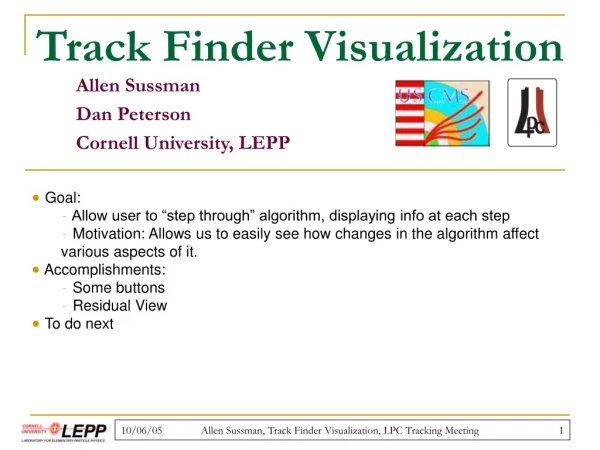
Track Finder Visualization Allen Sussman Dan Peterson Cornell University, LEPP • Goal: • Allow user to “step through” algorithm, displaying info at each step • Motivation: Allows us to easily see how changes in the algorithm affect various aspects of it. • Accomplishments: • Some buttons • Residual View • To do next Allen Sussman, Track Finder Visualization, LPC Tracking Meeting
Goal • Allow user to “step through” algorithm. • Motivation: Allows us to easily see how changes in algorithm affect certain aspects of it. Allen Sussman, Track Finder Visualization, LPC Tracking Meeting
Display r • Units: cm • Road is black rings. • Seed rings are green/red. • Track is red. • Hits are blue. z Allen Sussman, Track Finder Visualization, LPC Tracking Meeting
Accomplishments Stepping through algorithm r z Allen Sussman, Track Finder Visualization, LPC Tracking Meeting
Accomplishments Displaying info: Residual view, r-phi r radius z • Radius vs. res(phi) b/c track’s seed rings are barrels. • No errors displayed yet. Allen Sussman, Track Finder Visualization, LPC Tracking Meeting
Accomplishments Displaying info: Residual view, z-phi r z z Allen Sussman, Track Finder Visualization, LPC Tracking Meeting
To Do Next • Add errors to residual view. • How are errors stored? • More info about detector geometry: • sigma in pitch direction • stereo angles • Allow user to step through merging process. • Start running fitting/further pattern rec. Allen Sussman, Track Finder Visualization, LPC Tracking Meeting