Download
1 / 2
20 likes | 123 Vues
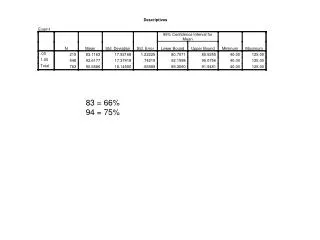
This report presents a detailed statistical analysis of performance metrics from Exam1, highlighting mean scores, standard deviation, and confidence intervals. The analysis evaluates key descriptive statistics, including minimum and maximum values, providing a comprehensive overview of the exam results. The findings aim to inform educators on student performance levels and identify areas for improvement in teaching strategies. This data serves as a valuable resource for understanding overall academic trends and enhancing educational outcomes.

E N D
83 = 66% 94 = 75%
Descriptives Exam1 N Mean Std. Deviation Std. Error 95% Confidence Interval for Mean Minimum Maximum Lower Bound Upper Bound .00 225 84.4389 17.69338 1.17956 82.1144 86.7633 40.00 125.00 1.00 538 93.2598 17.70926 .76350 91.7599 94.7596 40.00 125.00 Total 763 90.6586 18.14500 .65689 89.3690 91.9481 40.00 125.00 84 = 67% 93 = 74%