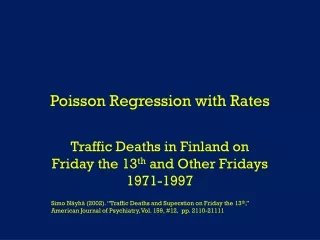
Poisson Regression
Poisson Regression. Caution Flags (Crashes) in NASCAR Winston Cup Races 1975-1979 L. Winner (2006). “NASCAR Winston Cup Race Results for 1975-2003,” Journal of Statistics Education, Vol.14,#3, www.amstat.org/publications/jse/v14n3/datasets.winner.html. Data Description.

Poisson Regression
E N D
Presentation Transcript
Poisson Regression Caution Flags (Crashes) in NASCAR Winston Cup Races 1975-1979 L. Winner (2006). “NASCAR Winston Cup Race Results for 1975-2003,” Journal of Statistics Education, Vol.14,#3, www.amstat.org/publications/jse/v14n3/datasets.winner.html
Data Description • Units: NASCAR Winston Cup Races (1975-1979) n=151 Races • Dependent Variable: • Y=# of Caution Flags/Crashes (CAUTIONS) • Independent Variables: • X1=# of Drivers in race (DRIVERS) • X2=Circumference of Track (TRKLENGTH) • X3=# of Laps in Race (LAPS)
Generalized Linear Model • Random Component: • Poisson Distribution for # of Caution Flags • Density Function: • Link Function: g(m) = log(m) • Systematic Component:
Testing For Overall Model • H0: b1 = b2 = b3 = 0 (# Cautions independent of all predictors) • HA: Not all bj = 0 (# Cautions associated with at least 1 predictor) • Test Statistic: Xobs2 = -2(L0-L1) • Rejection Region: Xobs2 ≥ c2a,3 • P-Value: P(c23 ≥ Xobs2) • Where: • L0 is maximized log likelihood under model H0 • L1 is maximized log likelihood under model HA
NASCAR Caution Flag Example Statistical output obtained from SAS PROC GENMOD
NASCAR Caution Flag Example • Conclude the following: • Controlling for Track Length and Laps, as Drivers Cautions • Controlling for Drivers and Laps, No association between Cautions and Track Length • Controlling for Drivers and Track Length, as Laps Cautions Reduced Model: log(Crashes) = -0.6876+0.0428*Drivers+0.0021*Laps
Testing Model Goodness-of-Fit • Two Common Measures of Goodness of Fit: • Pearson’s Chi-Square • Deviance • Both measures have approximate Chi-Square Distributions under the hypothesis that the current model is appropriate for fixed number of combinations of independent variables and large counts
NASCAR Caution Flags Example Note that the null model clearly does not fit well, and the full model fails to reject the null hypothesis of the model being appropriate (however, we have many combinations of Laps, Track Length, and Drivers)
SAS Program options ps=54 ls=76; data one; input serrace 6-8 year 13-16 searace 23-24 drivers 31-32 trklength 34-40 laps 46-48 road 56 cautions 63-64 leadchng 71-72; cards; 1 1975 1 35 2.54 191 1 5 13 ... 151 1979 31 37 2.5 200 0 6 35 ; run; /* Data set one contains the data for analysis. Variable names and column specs are given in INPUT statement. I have included ony first and last observations */ /* The following model fits a Generalized Linear model, with poisson random component, and a constant mean: g(mu)=alpha is systematic component, g(mu)=log(mu) is the link function: mu=e**alpha */ proc genmod; model Cautions = / dist=poi link=log; run; /* The following model fits a Generalized Linear model, with poisson random component, g(mu)=alpha + beta1*drivers + beta2*trkength + beta3*laps is systematic component, g(mu)=log(mu) is the link function: mu=e**alpha + beta1*drivers + beta2*trkength + beta3*laps */ proc genmod; model Cautions = drivers trklength laps / dist=poi link=log; run; quit;
Hosmer-Lemeshow Test • Used when there are “many” distinct levels of explanatory variables • Based on “lumping” together cases based on their predicted values into J (often 10 is used) groups • Compares observed and expected counts by group based on Deviance and Pearson residuals. For Poisson model (where obs is observed, exp is expected): • Pearson: ri = (obsi-expi)/√expi X2=ri2 • Deviance: di = √(obsi*log(obsi/expi)) G2=2 di2 • Degrees of Freedom: J-p-1 where p=#Predictor Variables
NASCAR Caution Flags Example Note that there is evidence that the Poisson model does not provide a good fit