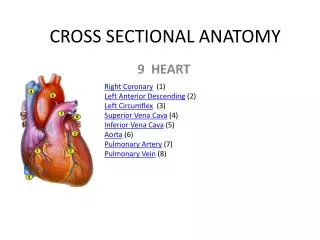
CROSS SECTIONAL STUDY
CROSS SECTIONAL STUDY. Framework of presentation. Design options in epidemiological research Cross sectional study Design of cross sectional study Steps of cross sectional study Analysis of cross sectional study with example Use of cross sectional study Advantage & disadvantage


CROSS SECTIONAL STUDY
E N D
Presentation Transcript
Framework of presentation Design options in epidemiological research Cross sectional study Design of cross sectional study Steps of cross sectional study Analysis of cross sectional study with example Use of cross sectional study Advantage & disadvantage Comparison with other studies
Design options in epidemiological research Experimental/ interventional studies Randomized controlled trial Field trial Community trial • Observational studies • Descriptive • Analytical • Ecological • Cross sectional • Case control • Cohort
Systematic Review & Meta-analysis Randomised Controlled Trials Analytical Studies Descriptive Studies Hierarchy of Evidence
Cross sectional study • when the investigator draws a sample out of the study population of interest, and examines all the subjects to detect those having the disease / outcome and those not having this outcome of interest. • at the same time finds out whether or not they have the presence of the suspected cause (exposure) (or give a History of such an exposure in the past), is called the Cross sectional analytic study.
Cross sectional study • A cross-sectional studies • a type of observational study • the investigator has no control over the exposure of interest. • It involves • identifying a defined population at a particular point in time • At the same time measuring outcome of interest e. g. obesity. Measure the prevalence of disease and thus are often called prevalence studies.
Cross sectional study • May be – Descriptive – Analytical or – Both • At descriptive level:it yields information about a single variable, or about each of number of separate variables in a study population • At analytic level:it provides information about the presence and strength of associations between variables, permitting testing of hypothesis
When to use cross sectional analytical study • If cases of the disease are not likely to be admitted, since the disease is perceived to be a routine illness. • If the disease has a wide clinical spectrum. • When the objective is not to study the cause of a disease but rather the cause of a health related phenomena. • When the objective is to see the correlation between two continuously distributed variables.
Steps in conducting cross sectional study • Step 1: State your research question ( SMART ) Specific Measurable Realistic Time bound Research hypothesis Objectives Background significance of the research question.
Step 2 : • Define the Total (whole, reference) population and the “actual (study) population from which the sample will be drawn. • Ensure that the actual population is a “representative subset” of the total population.
Step 3 - Specify your study variables and the ‘scales’ of measurements. `` • Outcome variable: dichotomous, polychotomous, continues, ordinal. • Exposure variable • Potential confounding factor: make a detailed list of all the variables that can confound the exposure - outcome relationship and specify the scales of their measurement
Calculate the Sample size : • Sample Size Determination for estimating a Mean
Sample Size Determination for estimating Proportion • Sample size ‘n’ is given by
Step 5 :Sampling methods • Probability sampling • Simple random sampling • Systematic sampling • Stratified random sampling • Cluster sampling • Non-probability sampling • Consecutive sampling • Convenience sampling • Purposive (Judgmental) sampling
STEP 6: Ensure Validity, reliability and prevent Bias • Validity: Validity is an expression of the degree to which a test is capable of measuring what it is intended to measure. • Reliability : is the extent to which repeated measurement of a stable phenomenon by different people and instrument at different time and place get similar results. • Bias: any trend in the collection, analysis ,interpretation, publication, review of data that can lead to conclusion that are systematically different from truth.
Fig showing relationship between the true value and measured values for low and high validity and reliability
Internal validity: is the degree to which the results of an observation are correct for the particular group of people being studied. • External validity or generalizability is the extent to which the results of a study apply to people not in it. • Internal validity is necessary for, but does not guarantee, external validity, and is easier to achieve.
Internal validity Measurement & confounding bias conclusion sample sample External validity
ERRORS IN EPIDEMIOLOGICAL STUDY • Random error (by chance) • Individual biological variation • Sampling error • Measurement error Systemic error Selection bias: occurs when comparison are made between group of patient that differ in determinant of outcome. EX: Sample bias Non response bias Non participation bias Berkson’s bias
Measurement bias: occurs when methods of measurement /classification of subjects are dissimilar among groups. • Interviewers bias • Recall bias • Response bias • Confounding bias: Confounding occurs when the effects of two exposures (risk factors) have not been separated and the analysis concludes that the effect is due to one variable rather than the other.
fig showing : Confounding : relationship between coffee drinking (exposure) , heart disease (outcome) , and third variable (tobacco use)
Strategies in dealing with systemic error • Confounding bias: • Restriction • Matching • Stratified analysis/Multivariate analysis • Misclassification bias: • Blinding • Minimal gap between theoretical and empirical definition of exposure/disease • Selection bias: • Population should be defined independently of disease of interest • All information on the subjects should be secured to avoid selective loss of information • Prevent loss to follow-up
DATA COLLECTION • pilot study on a sample of 10% of the total required. • sample for validating and standardizing all your instruments, questionnaire and techniques. • If data collection done by different data collectors, cross check at least 20% of the filled performae, independently for ensuring quality control of data and reducing observer variations.
Analysis of data • Analysis plan • Data cleaning • Depending on objective of study • Make dummy table
Analysis of descriptive CS study • Objective: • To describe the disease in time, place and person • To generate hypothesis • Analysis • Means & SD • Median & percentile • Proportions – Prevalence • Ratios • Age, sex or other group specific analysis
Analysis of analytical CS study • Objective: • Is there any association? • If “YES”, then what is the strength of association? • Analysis: • Is there any association? • Chi-square, student-t test, etc • What is the strength of association? • Odds ratio, Rate ratio , Rate difference, Difference between mean, Correlation , Regression coefficient. • Measure of impact • Risk factor • Attributable fraction (exposed) • Attributable fraction (population) • Protective factor • Prevented fraction (exposed) • Prevented fraction (population)
Measure of prevalence • Prevalence proportion: Proportion of the subjects who have the disease at a point in time • Example: • Of 1800 middle aged women 30 had diabetes on January 1, 2007. • The prevalence proportion of diabetes was 30/1800 = 0.016 or 1.6% • Point prevalence • Period prevalence
Point & Period prevalence Point prevalence Number of individuals with disease at a specified period of time P = --------------------------------------------------------------------- Population at that time Period prevalence Number of individuals manifesting the disease in the stated time period P = ----------------------------------------------------- Population at risk
Measures of association : odds ratio • OR- is the ratio of one odds to another. • It is the probability that something is so or will occur to the probability that is not so or will not occur. • Example:
Odds ratio Odds of disease among exposed Disease OR = ------------------------------------- Odds of disease among not exposed Odds of exposure among diseased Exposure OR = ------------------------------------- Odds of exposure among not diseased
Rate ratio • Prevalence ratio = {a/(a+b)}/{c/(c+d)} = 1.8 • Exposure ratio = {a/(a+c)}/{b/(b+d)} = 1.74 • Rate differences • Prevalence difference = {a/(a+b)} - {c/(c+d)} = 0.0444 • Exposure difference = {a/(a+c)} - {b/(b+d)} = 0.07 • Number needed to avoid one case in unexposed group = 1/prevalence difference = 1/0.0444=22.5
Measure of impact • If the factor is risk factor: • Excess risk among exposed= = {a/(a+b)} - {c/(c+d)} = 0.0444 • Population excess risk = = (a+c)/n – c/(c+d) = 0.004 • Attributable fraction (exposed)= = [(Prevalence ratio – 1)/Prevalence ratio] *100= 44.4 • Attributable fraction (population)= = [(Prevalence ratio – 1)*E]/{1+[(Prevalence ratio -1)*E]} *100= 7.4. E = exposure rate in population
Measure of impact : protective factor • If the factor is protective factor • Excess risk among unexposed = c/(c+d) – a(a+b) • Population excess risk = (a+c)/n – a(a+b) • Prevented fraction (exposed) = = {[c/(c+d) – a(a+b)]/[c/(c+d)}*100 • Prevented fraction (population)= ={[(a+c)/n – a(a+b)]/[(a+c)/n]}*100
Uses of cross sectional study • used as tool in community health care • Community diagnosis • Health care • Determinants of health & disease • Identification of group requiring special care • Surveillance • Community education & community involvement • Evaluation of community health care • Can contribute to clinical care (community oriented primary care) • Can provide new knowledge (studies on etiology , growth & development)
Guideline for critical appraisal of prevalence study 1. Are the study design & sampling method appropriate for the RQ? 2. Is the sampling frame appropriate? 3. Is the sample size adequate? 4. Are objective, suitable and standard criteria used to measure the health outcome? 5. Is the health outcome measured in unbiased manner? 6.Is the response rate adequate? Are the refusers described? 7.Are the estimates of prevalence given with CI & in detail by subgroup – if appropriate? 8.Are the study subjects and the setting described in detail ?
Cross sectional study advantage Cheap and quick studies. Data is frequently available through current records or statistics. Ideal for generating new hypothesis. Correlation between two continuously distributed phenomenon can be studied. Prevalence of the disease . Starting point of cohort study.
Cross sectional study Disadvantage • Needs large sample size. • Large number of logistic support needed. • The importance of the relationship between the cause and the effect cannot be determined. • Temporal weakness: – Cannot determine if cause preceded the effect or the effect was responsible for the cause. .
Choice of strategy for administrative purpose BEST
Advantage & disadvantage of different observational study design
Comparison of different study design case control cohort Cross sectional
References • Detels R, Mcewen J, Beaglehole R. Oxford Textbook of Public health, Fourth Edition, oxford university press. • Beaglehole R, Bonita R, Kjellstrom T. Basic Epidemiology. World Health Organisation, Geneva: AITBS Publishers;2006. • Fletcher RW, Fletcher SW, Clinical Epidemiology. 4th edition, Lippincott Williams & Wilkins. • Bhalwar R et al, Text Book of Public Health and Community Medicine. 1st edition, pune: Department of Community Medicine, Armed Forces Medical College;2009. • Deshmukh PR . Study design options in epidemiological research at MGIMS Sevagram 2011. • Abramson JH. Survey Methods in Community Medicine. 4th edition, Churchill Livingstone.