Hierarchical Models in Functional Imaging Analysis
Learn about hierarchical models for analyzing functional imaging data in SPM, including random effects analysis, Bayesian modeling, and dynamic causal modeling. Explore how hierarchical models can support Bayesian inference and why they are essential for statistical analyses in neuroscience research.

Hierarchical Models in Functional Imaging Analysis
E N D
Presentation Transcript
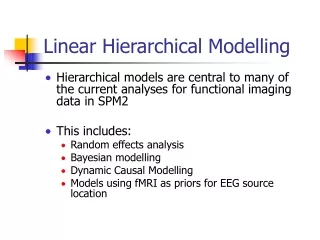
Linear Hierarchical Modelling • Hierarchical models are central to many of the current analyses for functional imaging data in SPM2 • This includes: • Random effects analysis • Bayesian modelling • Dynamic Causal Modelling • Models using fMRI as priors for EEG source location
A Two Level Hierarchical Model Y = X(1)(1) + e(1)(1st level) – within subject : (1) = X(2)(2) + e(2) (2nd level) – between subject Y = scans from all subjects X(n) = design matrix at nth level (n)= parameters - basically the s of the GLM (but becomes in hierarchical model – to confuse me!!!!!!!) e(n) = N(m,2) error we assume there is a Gaussian distribution with a mean (m) and variation (2)
Hierarchical form Squiggly line!! squiggly line!! Where are the donuts?? 1st level y = X(1) (1) +(1) 2nd level (1) = X(2) (2) +(2)
Hierarchical models • Hierarchical models a posit linear relations between variables with error terms which are Gaussian • In simple terms the GLM is a special case of hierarchical model with a single layer • Hierarchical models used at the second level can support Bayesian inference at the first level. • Thus, hierarchical models are essential for Bayesian statistics • Parameters - determine the expected response estimated from sample means (e.g the s from the GLM) • Hyperparameter – determines what causes the variation of the measured parameters (e.g for the t test - variation of observation error termed 2)
Random Effect Analysis • RFX is an example of how hierarchical modelling is used. • Used to find out what the stereotypical effect in the population is from the group of subjects that we have • We know that each subjects response’s varies from trial to trial (with-in subject variability) • Also, responses vary from subject to subject (between subject variability) • Both these are important when we make inference about the population
Random Effects Analysis - 2 • 12 subject study • Assumption - that the 12 subjects are drawn at random from the normal distributed population • If we only take into account the within subject variability we get the fixed effect analysis • If we take both within and between subjects we get random effects analysis
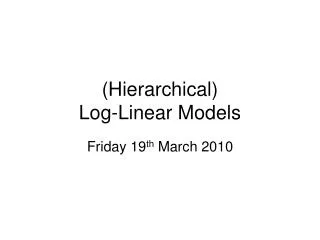
^ ^ ^ ^ ^ a12 a2 a11 a1 a ^ ^ ^ ^ s22 s211 s212 s21 Random Effects Analysis 1st Level 2nd Level DataDesign MatrixContrast Images SPM(t) One-sample t-test @2nd level
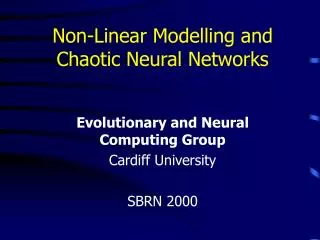
Two populations Estimated population means Contrast images Two-sample t-test @2nd level
How do we estimate the parameters and hyperparameters? • Parameter and Hyperparameters (Variance components) can be estimated using summary statistics or EM (ReML) • The gold standard approach to parameter and hyperparameter is the EM (expectation maximization). • EM • estimates population mean effect as MEANEM • the variance of this estimate as VAREM • Summary statistics • Avg[a] • Avg[Var(a)] • However, for balanced designs. • Avg[a] = MEANEM • Avg[Var(a)] = VAREM
Summary • In classical statistics - the parameters are be estimated (e.g. using the ordinary least squares) • Hyperparameter (covariance of the error) uses ReML • All the error terms of all the levels are grouped together and treated as a composite error for RFX • ReML – this is used to estimate unknown variance components without explicit reference to the parameters. • In classical inference one is usually interested only in the inference of the parameters at the highest level. (I.e. second level)
Any questions? Ask the Specialist Thanks to Will ?? SPM ?? ??RFX?? DONUTS