Worst Case Buffer Requirements for TCP over ABR
210 likes | 371 Vues
Worst Case Buffer Requirements for TCP over ABR. Bobby Vandalore, Shiv Kalyanaraman, Raj Jain, Rohit Goyal, Sonia Fahmy The Ohio State University Contact: Jain@cse.ohio-State.Edu http://www.cse.ohio-state.edu/~jain/. Overview. Why ATM ABR and ERICA TCP over ABR/ERICA

Worst Case Buffer Requirements for TCP over ABR
E N D
Presentation Transcript
Worst Case Buffer Requirements for TCP over ABR Bobby Vandalore, Shiv Kalyanaraman, Raj Jain, Rohit Goyal, Sonia FahmyThe Ohio State University Contact: Jain@cse.ohio-State.Edu http://www.cse.ohio-state.edu/~jain/
Overview • Why ATM • ABR and ERICA • TCP over ABR/ERICA • Generating Worst Case TCP Traffic • Analytical/simulation Results
Why ATM? • ATM vs IP: Key Distinctions • Traffic Management: Explicit Rate vs Loss based • Signaling: Coming to IP in the form of RSVP • PNNI: QoS based routing • Switching: Coming soon to IP • Cells: Fixed size or small size is not important
Old House vs New House • New needs:Solution 1: Fix the old house (cheaper initially)Solution 2: Buy a new house (pays off over a long run)
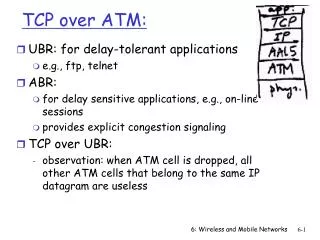
TCP over ABR: Buffering • Buffering depends heavily upon switch scheme. • For the ERICA scheme and the traffic loads considered: • W/o VBR, 3×RTT buffers will do for any number of TCP sources • In general, Qmax = a×RTT + b×Averaging Interval + c×Feedback delay + d×fn(VBR) • After TCP sources are rate-limited: Switch queues become zero, source queues build up
Worst Case TCP Traffic • Sources can retain high ACR, if they send packets within 500 ms. • Many such sources with high ACR can dump a large amount of data • Worst case is when all the sources dump the maximum window size
Worst Case (Cont) g g S1 S1 S2 S3 S1 • Each source sends one packet every ‘t’ milliseconds. t < 500 ms. • After several packets, the congestion window reaches the maximum for each source • Sources synchronize and dump large burst at the same time. • To avoid overload initially, the sources are uniformly spacedÞ kth source sends its first packet at ‘k×g’ s. S1 S2 SN t
N-Source Configuration Source 1 Destination 1 • All links 149.76 Mbps. Lengths x = 2000, 1000 km • All traffic unidirectional. Worst case TCP traffic • Parameters: # of sources={2, 3, 5, 10, 20, 30, …, 200}Infinite buffer size. Switch Switch Source N Destination N x km x km x km
Analytical results • Buffer requirement is reflected in maximum switch queue size. • Let cwnd_max = Max congestion window of TCP • When N <t/g • Max Q length N × cwnd_max/48 (formula 1) • When N > t/g 48 bytes/cell • Max Q length = N*PCR*t (formula 2) (PCR is peak cell rate) • Queue length is given in terms of number of cells
Analytical results (Cont) • With few sources, switch does not get congested even when sources reach their maximum window, ACRs can be high. Formula 1 applies here. • With many sources, switch detects congestion and gives feedback. ACRs are low. Formula 2 applies here.
Simulation Parameters • Source: Parameters selected to maximize ACRTBE = 512 CDF (XDF) = 0.5 ICR = 10 MbpsCRM (Xrm)= TBE/Nrm ADTF = 0.5 secPCR = 149.76 Mbps, MCR= 0, RIF (AIR) = 1, Nrm = 32, Mrm = 2, RDF = 1/512, Trm =100ms, TCR = 10 c/s • Traffic: TCP/IP with worst case traffic • Switch: ERICA+ Averaging interval = min{100 cells, 1000 s}
# TCP Q Size (Cells) # TCP Q Size (Cells) Srcs Simul. Analyt. Srcs Simul. Analyt. 2 1575 2730 70 30109 25690 3 3149 4095 80 31439 29360 5 6297 6825 90 34530 33030 10 14131 13650 100 38088 36700 20 29751 27300 120 44939 44040 30 20068 11010 140 44744 51380 40 19619 14680 160 48880 58720 50 24162 18350 180 49961 66060 60 28006 22020 200 55618 73400 Effect of Number of Sources
Effect of # of Sources (Cont) • Analytical results: For t = 1 ms, g = 50 ms, MSS = 512 bytes, cwnd_max = 64 kB • Q = N*1365 for N < 20 (formula 1) • Q = N*367 for N > 20 (formula 2) • The zig-zag shape is due to the two formulas • The simulation agrees well with the analytical results for N < 20. • The maximum queues occurred at predicted times (details in the contribution)
Effect of # of Sources (Cont) • Buffer size increases linearly as number of sources increase • As N increases, load increases Þ ERICA+ controls the queue lengths Þ Less than analytical queue lengths
# mss/g/t/d N=3 N=10 N=30 N=40 N=50 N=100 1 512/50/1/1000 3171 14273 20068 19619 24162 35687 2 512/50/1/2000 3171 14273 19906 27567 30872 75083 3 512/50/10/1000 3172 14274 45994 61854 77714 150453 4 512/50/10/2000 3172 14274 45994 61854 77714 150458 5 512/100/1/1000 3171 14273 19283 20080 24164 NA 6 512/100/1/2000 3171 14273 21241 32314 35961 NA 7 512/100/10/1000 3172 14274 45994 61854 77714 NA 8 512/100/10/2000 3172 14274 45994 61854 77714 NA 9 1024/50/1/1000 3040 13680 18650 18824 23542 NA 10 1024/50/1/2000 1542 5612 19131 22934 29163 NA 11 1024/50/10/1000 3040 13680 44080 59280 74480 NA 12 1024/50/10/2000 3041 13681 44081 59281 74481 NA 13 1024/100/1/1000 3040 13680 18591 19600 24314 NA 14 1024/100/1/2000 1403 5556 17471 24412 30533 NA 15 1024/100/10/1000 3040 13680 44080 59280 74480 NA 16 1024/100/10/2000 3041 13681 44081 59281 74481 NA Sensitivity Analysis
Sensitivity Analysis: Results • MSS = 512, 1024 bytes, t = 1, 10 ms, g = 50, 100 ms, Link distance = 1000, 2000 kmTwo values for each of the 4 parameters Þ 16 experiments. • Segment size does not affect queue sizes • If the network is not overloaded then round trip time has no effect (Expt. 3 and 4) • If the network is overloaded then a larger round trip gives larger queue lengths (Expt. 1, 2 for N = 30, 40, 50)
Summary • Traffic management distinguishes ATM from other high-speed protocols • ABR pushes congestion to edges. Buffering depends upon the switch algorithm • ERICA requires 3×RTT buffering for TCP
Summary (Cont) • In worst case, the buffer requirements depend on the number of sources, network congestion status (overloaded or underloaded) and round trip time • It is not affected by maximum segment size.
Our Contributions and Papers • All our contributions and papers are available on-line at http://www.cse.ohio-state.edu/~jain/ • See Recent Hot Papers for tutorials.