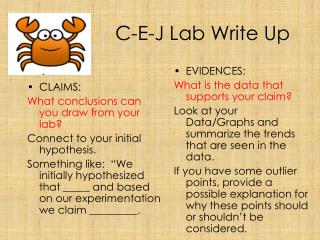
Fruit Fly Lab Write-up
0. Fruit Fly Lab Write-up. 0. The Fly Family Tree. P Generation- Set up by the supply company-removed before shipping. F 1 Generation- The flies you started your culture with. F 2 Generation- The flies you counted. These are the offspring of the F 1. 0. Specific Write-up reminders:.


Fruit Fly Lab Write-up
E N D
Presentation Transcript
0 Fruit Fly Lab Write-up
0 The Fly Family Tree • P Generation- Set up by the supply company-removed before shipping. • F1 Generation- The flies you started your culture with. • F2 Generation- The flies you counted. These are the offspring of the F1.
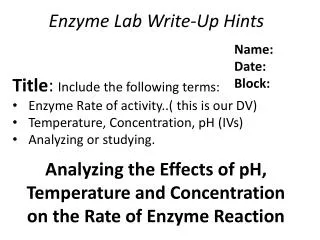
0 Specific Write-up reminders: • Lab is a formal write-up. • You must include your raw data. • You need a null hypothesis (Ho) and an alternative hypothesis (Ha).
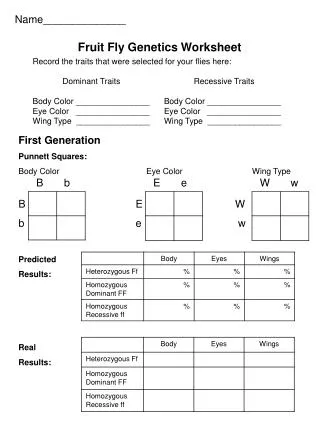
0 The Hypothesis • Ho: There is no significant difference between the expected and observed results, following the phenotypic ratio of 1:1:1:1 (enter your ratio here!). • Ha: There is a significant difference between the expected and observed results following the phenotypic ratio of 1:1:1:1.
0 Step 1 • Decide on what type of cross you had. There were three possibilities. • Monohybrid • Dihybrid • Sex linked • Ask: • Do I have any white eyes • Does only one trait vary? • Do two traits vary?
0 Total each category • Sex-linked (4 categories) • Red eyed ♀ -Red eyed ♂ • White eyed♀ -White eyed ♂ • Monohybrid (2 categories) for instance: • Apterous vs. wild • Sepia vs. wild • Dihybrid (4 categories) for instance: • Wild/wild -sepia/wild • Apterous/sepia -apterous/wild
0 Step 2 • Apply the Chi-square statistic. • X2 = Σ • O=observed number in a phenotypic category • E=expected number in a phenotypic category • X2= “chi-square” • Σ = sigma “sum of” (O-E)2 E
0 Example #1 Monohybrid • Data: 69 wild (red), 31 sepia=100 total flies counted • A monohybrid cross is a 3:1 ratio according to the punnett square so you expect: • 3 out of 4 to be dominant or ¾ • 1 out of 4 to be recessive or ¼ • Multiply the total number counted by the ratio to get the expected number: • 100 x ¾ = 75 100 x ¼ = 25 • Solve: X2 = (69-75)2 + (31-25)2 75 25 .48 + 1.44 =1.92 • X2= 1.92
0 Interpreting the Chi Square • Decide how many degrees of freedom you have in this problem. • D of F = The number of phenotypic categories – 1. • There are two categories in the sample problem: 2-1=1 degree of freedom. • Look your Chi Square value up in the chart in your lab book.
0 • The X2 (Chi-Square) Distribution ChartProbability Valuesdf 0.05 0.025 0.01 0.001 • 1 3.841 5.024 6.635 10.828 2 5.991 7.378 9.210 13.816 3 7.815 9.348 11.345 16.266 4 9.488 11.143 13.277 18.467 5 11.070 12.833 15.086 20.515 6 12.592 14.449 16.812 22.458 Use the .05 probability column or “significance level” If your chi-square value is less than this value you “fail to reject” your null hypothesis. This means you are 95% confident any variation between your population and the one you thought you had (in the null hypothesis) is due to chance alone ( 5% of the true null hypotheses will be rejected). If your chi-square value is greater you reject your null hypothesis (there is little chance they are the same population). Our problem: X2= 1.92 Critical value= 3.842 Fail to reject
0 Example #2 Dihybrid Cross Expected Values: 47 x 9/16 = 26.4 47 x 3/16 = 8.8 47 x 3/16 = 8.8 47 x 1/16 = 2.9 Observed data Calculations: X2 = Σ(O-E)2 E X2 = Σ(25-26.4)2 + (9-8.8)2+ (8-8.8)2 + (5-2.9)2 26.4 8.8 8.8 2.9 .07 + .0045 + .07 + 1.5 = 1.67 D of F = 4-1= 3 Critical value= 7.815 X2 is less 1.67< 7.815 Fail to reject
0 Example #3 Sex-Linked • P1= Xr Xr x XRY • F1 = XR Xrx Xr Y • F2 = 1:1:1:1
0 Expected: Total x ¼ Observed: Calculations: X 2 = Σ(O-E) 2 E X 2 = Σ(78-71) 2 + (69-71) 2 + (62-71) 2 + (73-71) 2 = 1.95 71 71 71 71 D of F = 4-1= 3 Critical value= 7.815 X 2 is less than critical value 1.95>7.815 Fail to reject
0 Why do we “fail to reject” instead of accept? • In the words of Gerry Rau, Lincoln American School in Taiwan on the AP Biology Teachers List: • A chi-square less than the critical value leads to the conclusion that the null hypothesis cannot be rejected, which is slightly different from being accepted. It may be that it cannot be rejected (proven false) due to small sample size, large variation in the data, etc. The distinction is that it may be possible to prove something false, but impossible to prove something true. Example: If someone says ‘I always tell the truth’, you only need to show one example of a lie to prove it false, but a thousand examples of telling the truth, while providing substantial evidence, cannot prove it true.