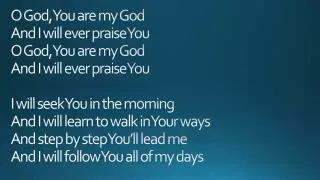
Projections - A Step by Step Tutorial
Projections - A Step by Step Tutorial. By Chee Wai Lee For the 2004 Charm++ Workshop. Outline. Introduction to Projections. Basic features. Advanced features. Basic performance analysis techniques. Soon-to-be ready features. An Introduction to Projections.

Projections - A Step by Step Tutorial
E N D
Presentation Transcript
Projections - A Step by Step Tutorial By Chee Wai Lee For the 2004 Charm++ Workshop
Outline • Introduction to Projections. • Basic features. • Advanced features. • Basic performance analysis techniques. • Soon-to-be ready features.
An Introduction to Projections • Performance Analysis tool for Charm++ based applications. • Automatic trace instrumentation. • Post-mortem visualization. • Multiple advanced features that support: • Data volume control • Generation of additional user data.
Basic Features (outline) • Changes to code (none!) • Link time decisions. • Run time decisions (none!) • Basic Visualization.
Coding, Linking & Running • No changes to Charm++ program required! • Choose and link an appropriate trace module. • Tracemode “projections” • Tracemode “summary” • No changes required to the way application is run. • Example program - Jacobi2D
Tracemode Projections • Each Charm++ event appears as a line of text in log file. • At link time, specify “-tracemode projections” • Supported by all views in the visualization tool.
Tracemode summary • Contains: • Processor utilization information over entire run. • Total execution time attributed to each Charm++ entry method. • Number of times each entry method is called. • At link time, specify:“-tracemode summary” • Limited visualization support.
Visualization - outline. • Summary mode • Summary graph screen. • Overview. • Usage Profile. • Miscellaneous • Dialog box features.
Visualization - outline (cont) • Projections Log mode • Overview and Usage Profile as before. • Flexible Graph view. • Histograms. • Time Profile. • Timeline. • Animations. • Miscellaneous features.
The Summary View • Provides a view of the overall utilization of the application. • Very quick to load.
Overview • Shows utitlization as a color scale split by processor over time. • Useful for identifying the processor responsible for bad behavior.
Usage Profile • Shows the contribution of utilization by each entry point. • Useful for identifying badly behaved entry points.
Dialog boxes • Flexible processor specification string. E.g. “0,2-5,45-127:5” • Ability to save up to 5 commonly used time ranges
Overview & Usage Profile • These views are similar to the ones for summary-based visualization. • They may differ somewhat because additional information (eg. Idle time) becomes available in full log traces. • They also take longer to load.
Graph View • Features: • Selectively view Entry points. • Convenient means to switch to between axes data types.
Histograms - time based • Divide the time spent by entry methods into various bin sizes and count them. • Useful for determining if there’s a grainsize problem.
Histograms - communication • Frequency counts for communication-based properties.
Time Profiles • Shows the spread of Charm++ entry methods over time.
Timeline • The most detailed view in Projections. • Useful for understanding critical path issues or unusual entry point behaviors at specific times.
Miscellaneous Features -Color Selection • Colors are automatically supplied by default. • We allow users to select their own colors and save them. • These colors can then be restored the next time Projections loads.
Advanced Features - outline • User APIs • Runtime tracing options • Visualization support for features.
User APIs • Controlling trace generation • void traceBegin() • void traceEnd() • Tracing User Events • int traceRegisterUserEvent(char *, int) • void traceUserEvent(char *) • void traceUserBracketEvent(int, double, double) • double CmiWallTimer()
Runtime options • +traceoff • +traceroot <directory> • Projections mode only: • +logsize <# entries> • +gz-trace • Summary mode only: • +bincount <# of intervals> • +binsize <interval time quanta (us)>
User Events (cont) • Detailed information about User Events can be acquired via a table.
Monitoring messages • Right-clicking on an entry method in Timeline causes a line to be drawn from the corresponding send event.
Soon-to-be ready features • Instrumenting function calls in AMPI. • Flexible Performance counter data acquisition.
Instrumenting AMPI function calls. • REGISTER_FUNCTION(“user function description string”); • TRACE_FUNC(<func call code>,“user function description string”);