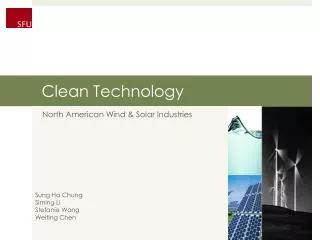
Clean Technology
Clean Technology. North American Wind & Solar Industries. Sung Ha Chung Siming Li Stefanie Wong Weiting Chen . Agenda. Overview Revolution of Clean Tech Energy Generation Segment Wind & Solar Energy Companies First Solar Inc. Canadian Solar Inc. ETF Global Wind Energy Index Fund.

Clean Technology
E N D
Presentation Transcript
Clean Technology North American Wind & Solar Industries Sung Ha Chung Siming Li Stefanie Wong Weiting Chen
Agenda • Overview • Revolution of Clean Tech • Energy Generation Segment • Wind & Solar Energy • Companies • First Solar Inc. • Canadian Solar Inc. • ETF • Global Wind Energy Index Fund
Clean Tech Industries Overview
Revolution of Clean Tech • In the 1970s, clean tech was considered “alternative” • Environmentalism and lifestyle advocates • Too expensive & lack of political support “Clean technologies are designed to provide superior performance at a lower cost while creating significantly less waste than conventional offering – promises to be the next engine of economic growth.” – Ron Pernick Source: The Clean Tech Revolution by Ron Pernick
Revolution of Clean Tech • Six reasons why it is prevalent today • Costs • Capital • Competition • Consumers, • Climate • China
Key Industry Segments • Energy Generation • wind, solar, geothermal, etc. • Energy Storage • Fuel Cells, Advanced Batteries • Energy Infrastructure • Energy Efficiency • Transportation Source: Cleantech Group
Industry Segments • Water & Wastewater • Air & Environment • Materials • Manufacturing/Industrial • Agriculture • Recycling & Waste Source: Cleantech Group
Energy Generation Overview
Energy Generation • Wind • Solar • Hydro/Marine • Biomass • Geothermal • Other
US Energy Production and Consumption 2009 Source: US DOE
US Energy by Energy Source 2000-2009 Production Consumption Source: US DOE
Cost of Renewable Energy by Technology 2009 Source: US DOE
Cost of Conventional Energy Source: First Solar Inc.
US Capacity & Generation 2009 Source: US DOE
US Capacity & Generation 2009 (excluding hydropower) Source: US DOE
US Capacity & Generation 2009by Source Source: US DOE
Top States for Renewable Electricity Installed Nameplate Capacity 2009 Source: US DOE
Top States Renewable Electricity Installed Nameplate Capacity 2009 Source: US DOE
Renewable Electricity Capacity Worldwide Source: US DOE
Worldwide Renewable Electricity Generation Capacity Source: US DOE
Top Countries with Installed Renewable Electricity Source: US DOE
Top Countries with Installed Renewable Electricity by Technology 2009 Source: US DOE
Industry Development • Global renewable electricity installations have more than tripled from 2000-2009 • Renewable energy accounts for 21% of global electricity generation (including hydropower); 3.8% excluding hydropower • Wind and solar PV fastest growing; capacity grew 14x between 2000-2009 • In 2009, Germany led the world in cumulative solar PV installed capacity. The US leads in wind, geothermal, biofuels, and CSP
Government Energy Subsidies • Industry reliant on government subsidies • Subsidies takes 4 main forms: • Direct Expenditures • Tax Expenditures • Research and Development • Targeted Programs & Indirect support(i.e.: Loans Guarantees programs by US Department of Agriculture)
Feed-in Tariff • Industry benefited from introduction of feed-in tariff (FiT) • a policy mechanism designed to encourage the adoption of renewable energy • As a government mandate, utility companies pay the homeowners, business and organizations to generate their own electricity • First implemented in US in 1978 by president Jimmy Carter • As a reaction to 1970’s energy crisis • As of 2009, FiT enacted in 63 jurisdictions around the world • Denmark, Spain, and Germany
Government Energy Subsidies in 2007 Source: US EIA
Wind Energy Industry Overview
Wind Energy Technology • Two modern wind turbines • Vertical-axis • Horizontal-axis Vertical-axis wind turbine Horizontal-axis wind turbine
Wind Farms Onshore Wind Farm Offshore Wind Farm
Industry Development • US installed wind energy capacity increased almost 14x between 2000 and 2009 • US wind experienced record growth in 2009 and nearly 10 GW of new capacity was added • Texas led the United States in wind installations in 2009, installing more than 2,292 MW of wind capacity • In 2009, average price of wind power was about $0.40 per kilowatt hour — a price that competes with fossil fuel-generated electricity • In 2009, China surpassed US as the world leader in annual installed wind capacity, with more than 13.8 GW added.
*Estimated from 2010 contracts Industry Performance • $13.13 billion in revenues in 2010* • Contracted 0.3% annually since 2005 • Recession and competition from other alternative energy sources Source: IBIS World
Turbine Manufacturers Source: US DOE
US Wind Energy Nameplate Capacity and Generation Source: US DOE
US Wind Power Sales Price Source: US DOE
Wind Energy Capacity 2009 Source: US DOE
Solar Energy Industry Overview
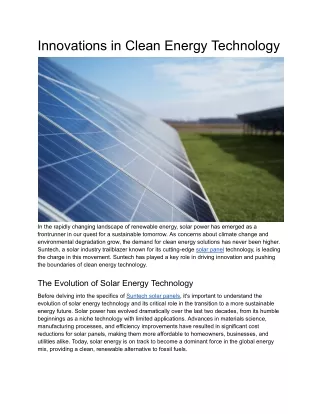
Solar Energy Technology • Solar Thermal • Uses energy from the sun to heat water & buildings or generate electricity • Photovoltaic (PV) Systems • Conversion of sunlight directly into electricity • PV solar panels • Concentrated Solar Power (CSP) The solar furnace at Odeillo France PV CSP
Industry Development • Solar energy electricity generation has nearly 4x between 2000 and 2009, but still represents a very small part of overall U.S. electricity generation. • Countries with aggressive solar policies—such as Germany, Spain, and Japan— lead the world in solar photovoltaic (PV) deployment. • China is the market leader with nearly 40% of the global PV cell production. • A number of concentrating solar power (CSP) plants came online in 2009, including 12 MW in the United States and 120 MW in Spain.
*Estimates Industry Performance • $57.98 billion in revenues in 2010* • Annual growth of 4.7% 2005 • Higher levels of electricity generation and higher price Source: IBIS World
Photovoltaic Manufacturers Source: US DOE
US Solar Energy Capacity and Generation Source: US DOE
US PV Power Sales Price Source: US DOE
Solar Energy Installed Capacity 2009 Source: US DOE
Comparison of 37 Month Cumulative Total Return Source: First Solar Annual Report
Company Snapshot • Formed in 1999 and launched production of commercial products in 2002 • IPO on Nov17, 2006 • 1st pure-play renewable energy company added to the S&P 500® composite index • Ranked #7 on Fortune's list of 100 fastest growing companies, and #1 on its list of profit growth for energy companies.