Solid/Liquid Systems
Solid/Liquid Systems. Phase Diagrams Phase Rule Lever Rule. LIQUID. T. SOLID. X B. COOLING CURVE. START. LIQUID. T. SOLID. FINISH. X B. COOLING CURVE. liquid cools. T. solid forms and cools. solid cools. time. COOLING CURVE. liquid cools. T. solid forms and cools.

Solid/Liquid Systems
E N D
Presentation Transcript
Solid/Liquid Systems Phase Diagrams Phase Rule Lever Rule
LIQUID T SOLID XB
COOLING CURVE START LIQUID T SOLID FINISH XB
COOLING CURVE liquid cools T solid forms and cools solid cools time
COOLING CURVE liquid cools T solid forms and cools solid cools time How do I know its shape???
THE PHASE RULE F = C + 2 - P F = degrees of freedom ( How many variables? ) C = components P = phases
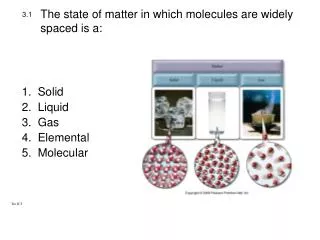
S o l i d P Liquid 100 KPa Gas T 273K 373K
This is a one component system as it contains only water. Therefore, F = 1 + 2 P = 3 P
P = 1 F = 2 Pressure & T vary independantly S o l i d P Liquid 100 KPa Gas T 273K 373K
On line P = 2 F = 1 Pressure or T can vary S o l i d P Liquid 100 KPa Gas T 273K 373K
S o l i d P Liquid 100 KPa Gas At the triple point P = 3 and F = 0 Pressure and T are fixed. T 273K 373K
LIQUID T SOLID XB
This is a two component system as it contains two different compounds. Therefore, F = 2 + 2 P = 4 P I use up one degree of freedom by fixing the pressure. F = 3 P
P = 1 F = 2 T and XB vary. LIQUID P = 2 F = 1 T SOLID P = 1 F = 2 T and XB vary. XB
COOLING CURVE liquid cools T solid forms and cools solid cools time How do I know its shape???
COOLING CURVE The temperature can vary because the compositions can change. liquid cools T solid forms and cools solid cools time
LIQUID T SOLID XB A tie line
A tie line At a given temperature, a tie line tells us what the compositions of the two phases are. It can also tell how much of each is present.
A tie line At a given temperature, a tie line tells us what the compositions of the two phases are. It can also tell how much of each is present. The compositions of the phases are deteremined from the ends of the line. The amounts are determined from the Lever Rule.
Lever Rule f f f This is a tie line for system expressed in mass fraction. f = mass fraction for whole system f = mass fraction of the phase f = mass fraction of the phase
Lever Rule f f f The system balances like a lever: m f f = m f f m is the mass of the phase.
A bit more complicated? The NaCl / NaBr system.
NaBr / NaCl at 101 325 Pa o C LIQUID 800 760 720 .25 .50 .75 XNaCl
NaBr / NaCl at 101 325 Pa o C LIQUID 800 X 760 Y 720 Z .25 .50 .75 XNaCl
THREE TIE LINES: X is pure NaCl Crystals in equilibrium with a solution of NaCl and NaBr. 50 mole % NaCl Y Z
NaBr / NaCl at 101 325 Pa o C LIQUID 800 X 760 Y 720 Z .25 .50 .75 XNaCl
THREE TIE LINES: X is pure NaCl Crystals in equilibrium with a solution of NaCl and NaBr. Y is pure NaBr Crystals in equilibrium with a solution of NaCl and NaBr. 25 mole % NaCl Z
NaBr / NaCl at 101 325 Pa o C LIQUID 800 X 760 Y 720 Z .25 .50 .75 XNaCl
THREE TIE LINES: X is pure NaCl Crystals in equilibrium with a solution of NaCl and NaBr. Y is pure NaBr Crystals in equilibrium with a solution of NaCl and NaBr. Z is pure NaCl crystals and pure NaBr crystals.
NaBr / NaCl at 101 325 Pa o C LIQUID 800 ? 760 720 .25 .50 .75 XNaCl
This point is called a EUTECTIC or minimum melting point. 28 mole % NaCl at 731 o C.
NaBr / NaCl at 101 325 Pa TWO COOLING CURVES o C X LIQUID 800 Y 760 720 .25 .50 .75 XNaCl
T The T falls because 2 phases give degree of freedom. time (x) T The T is fixed because there are 3 phases and zero degrees of freedom. time (y)
NaBr / NaCl at 101 325 Pa TWO COOLING CURVES o C X LIQUID 800 Y 760 720 .25 .50 .75 XNaCl