Download
1 / 74
740 likes | 946 Vues
ISyE 6203 Transportation & Supply Chain Systems. John H. Vande Vate Fall 2011. What aspects of the financial goals of the organization do Supply Chain activities contribute to? How do we measure these aspects of Supply Chain activities?

E N D
ISyE 6203Transportation & Supply Chain Systems John H. Vande Vate Fall 2011 1
What aspects of the financial goals of the organization do Supply Chain activities contribute to? How do we measure these aspects of Supply Chain activities? Financial goals often conflict. What tools are available to help Supply Chain find the right balance What tools are available to help improve SC performance Motivate by simple examples Integrate via an industrial project My Approach 2
That we understand the main SC objectives That we can assess the effects of proposed initiatives on those objectives That we develop some skill and intuition for identifying effective initiatives That we are armed with some practical tools for designing, balancing and optimizing SC activities. That we have some real experience doing all of these Goals 3
Organizations are adept at managing forecasted flows Most still struggle with forecast (in)accuracy and unforecasted variability We will start with a deterministic view through the mid-term. Focus on managing variability after the mid-term Deterministic vs Stochastic 4
We will work in teams of 4-5 on a project and on improving “Our Company” performance You should select your team members by Thursday, September 1st end of class One person from each team should send me an e-mail with the subject line 6203 Teams with The names and contact information (e-mails and phone numbers) of the team members Resumes of all the team members T-Square User IDs of the team members Project Teams 5
Dell – Confirmed but evolving Project 1 Optimization of the 3rd Party Distributor network Project 2 Optimization of FedEx Ground and FedEx Home networks Project 3 Sensitivity of network to cost drivers, eg pallet weight Project 4. Returns network UTi – 3PL and Freight Forwarder How much capacity on a lane should we secure via block space agreements How would a change in the variability of a customer’s actual freight volumes (weight and cube) affect UTi’s profitability on that lane The Projects 6
Audi TBA The Projects 7
3 Steps (Adaptable) Step 1: Formal project statement, summary of the data and rough estimates of the potential impacts of various alternatives. Step 2: Analyze and optimize the top alternatives and develop detail assessments of their cost and service impacts Step 3: Present your assessment and recommendations to management, including an evaluation of more qualitative risks and opportunities associated with each strategy. Project Structure 8
Each team will make a 20 – 30 minute presentation to me for each step. Each team will make at least one presentation to the class (most will present the final project) Each team will present to the client (probably via phone or internet) An organized CD or T-Square files that facilitate the transfer of your project. I will set up Team Project Forums on T-Square Deliverables 9
Organize your team Introductory conference call with sponsor (working to schedule these the week of Sept 5. TBA) First Steps 10
We will schedule roughly bi-weekly conference calls with our sponsor. Usually in 226 (arranged via Meka Wimberly meka.wimberly@isye.gatech.edu) Not necessary that everyone be there, but it’s better. Someone from you team should take careful notes and post them as meeting minutes on the Project Forum You are responsible for organizing conference calls. Conference Calls 11
Two Exams Mid-term Final: Tuesday, December 13th from 11:30 – 2:30 Grading: Project 30% Mid-term: 30% Final: 30% Team Presentations: 10% Warning: People struggle with my exams Academic Honesty Course Organization 12
No text book. I’ve listed some good resources on the class web page (see T-Square) I will provide selected readings and links to additional information Radical Tools (an Excel Add-in) in the Labs MapPoint 2010 available for free from http://msdn08.e-academy.com/gatech_isye I believe it comes as a DVD and so takes time to deliver. Please let me know if you learn otherwise. Text 13
Feel free to send questions via e-mail Or drop by my office: 222 of old ISyE bldg Feel free to schedule a meeting via e-mail Anonymous feedback on each lecture via T-Square (under Tests & Quizzes – I used “Anonymous grading only” so I don’t see your identity). Questions? 14
I have to be out of the country from September 10th through 22nd I will arrange three guest lectures during that period One classes set aside for team project meetings Travel 15
Today: Introduce Our Company and evaluate its performance Coming Weeks: Develop a distribution strategy to improve Our Company’s financial performance These will be Team Presentation Assignments Our Company 16
Products: Computers: CPU, Monitor Televisions: TV and Console Stores 100 across the US Sell 10 TVs and 10 computers per day 250 days/year Overview 17
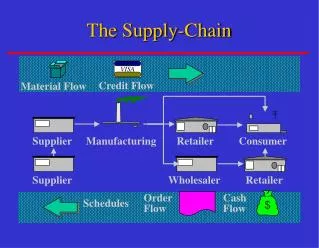
Components We assume a truck holds 30,000 lbs and travels 500 miles/day 18
All direct shipments in full truckloads Current Operations 19
Shipments on the order of 1,000 miles Simplification Use your head! Make an estimate. Refine it. Averages Green Bay: 969 Indianapolis: 854 Denver: 1,006 20
Our Company.xls • Enable Macros • ArcCos • Distance: Computes the distance in miles between two latlong coordinates • Or you can use the Radical Tools add in available in the labs. (We won’t work with distance much initially) • Components: Cost, weight, source • Products: BOM, Selling price • Locations: LatLongs of stores and plants, distances • Financials: Income Statement, Balance Sheet, Metrics 21
“Operating efficiency and working capital management remain a key focus of the company's business initiatives to grow sales faster than the market, grow profits faster than sales, and increase return on invested capital.” Arrow Electronics Annual Report Market Share Profitability Return on invested capital 24
SC & Finance “Corporation managers generally claim that they have four broad responsibilities: to consumers, to employees, to stockholders, and to the general public … each group is on an equal footing: the function of management is to secure justice for all and unconditional maxima for none. Stockholders have no special priority; they are entitled to a fair return on their investment, but profits above a ‘fair’ level are an economic sin.” Sutton et al. The American Business Creed 1956 25
Income Statement Balance Sheet Financial Goals 26
SC helps drive revenue Superior service commands higher price and loyalty Product availability drives sales Integrated operations can become a barrier to changing suppliers Speed of product introduction can win market share … Our Company: Revenues = $450 Million Revenue 27
COGS: Cost of Goods Sold Includes all costs of material, labor, and allocated overhead, purchase, conversion and other costs incurred in bringing the inventories to their present location and condition. Prices change. So there are various methods for reconciling: specific identification, first-in first-out (FIFO) average cost That’s accounting, we won’t worry to much about the accounting standards. Profitability 30
You can read more about COGS at http://en.wikipedia.org/wiki/Cost_of_goods_sold Or for a quick practical overview, http://learndirecthmmdemo.lmmattersonline.com/courses/hmm10/budgeting/documenting_revenue_forecasts.html Our Company COGS consists of Raw Materials: $300 Million Labor: $1.41 Million Transportation: ? COGS Not required Not required 31
Gross Margin • Gross Margin = Revenue – COGS • Gross Margin as % of Sales = Our Company: Low transportation costs ensure high Gross Margin For more details see http://en.wikipedia.org/wiki/Gross_Margin Not required 32
SG&A: Selling, General & Administrative includes costs for research and development, product design, marketing, distribution, customer service, commissions, administration, and overhead. Our Company: SGA = $26.2 Million For more discussion see, for example, http://www.investopedia.com/terms/s/sga.asp SG&A Not required 33
Typically not a major SC consideration for us. Has to do with expensing large capital asset investments like plants and equipment Except for Depreciation, Profitability is driven by revenue and operating EXPENSES Depreciation & Amortization 34
Earnings Before Interest & Taxes Gross Margin minus SG&A Amortization & Depreciation Impairments and other expenses Operating Income (EBIT) 35
Might find “Capital Productivity: Why the US Leads and Why it Matters” interesting. McKinsey Quarterly, 1996 Issue 3 Available from eJournals at www.library.gatech.edu Focus on “Why it Matters”. Might be interesting to reflect on the “Why US leads” aspects in light of financial crisis. Why Capital Utilization? Not required 37
Differences in capital markets Differences in employment models Differences in political economies A broader perspective on “goldplating” Digression on US vs German Capital Utilization 38
“Productivity” of capital How well capital investments are employed to deliver goods and services From an investor perspective, related to the return available from investment Note the INVESTMENT perspective. Capital Utilization driven by Revenue and INVESTMENT Capital Utilization 39
Productivity of Capital • Productivity of Capital (SPEED) • Return on Invested Capital (ROIC) • Our Company: Reducing Inventories improves SPEED and ROIC • For more information see • http://news.morningstar.com/classroom2/course.asp?docId=145095&page=9&CN=COM Not required 40
NOPAT: Net Operating Profit After Taxes NIBCLs: Non-interest bearing current liabilities, eg., accounts payable NOPAT & NIBCLs 41
Fixed Capital Assets Plants and Equipment Working Capital Inventories or raw materials and finished goods Accounts receivable Accounts payable For more on Working Capital see http://en.wikipedia.org/wiki/Working_capital Two kinds of Capital Not required 42
The cash required to finance operations The Cash-to-Cash cycle Organization must have capital to fund raw materials, etc. from the time it pays for them to the time it’s customers pay for the corresponding finished goods Working Capital 43
= + - Working Capital What our suppliers finance for us What we finance for our customers 44
Working Capital: AR • Typically most meaningful when expressed in terms of time • Days Sales Outstanding • Example: Our Company • Receivables: $18.493 Million • Sales: $450 Million or about $1.233 million/day • DSO: 15 days 45
Working Capital: AP • Days Payables Outstanding • Example: Our Company • Accounts Payable: $24.733 Million • COGS: $301.4 million plus transportation or about $826 thousand/day + avg daily transportation • DPO: 30 days (ignoring transportation) 46
Working Capital: Inventory • Days in Inventory • We will have to do some work to estimate Inventory • Normally this would be an accounting process: How much inventory do we have? • We will estimate inventory. Why? 47
Days Sales Outstanding: 15 days Days in Inventory: + ? days Days Payables Outstanding:30 days Cash-to-Cash Cycle: ? days Our Company: Net net, our suppliers fund 15 days of operations. Depending on inventories, we must fund the rest. Cash-to-Cash Cycle 48
Dell’s Cash-to-Cash Cycle That’s about $4.7 billion Dell’s suppliers finance a month + of Dell’s operations 49
SC can influence DSO by providing perfect order delivery, prompt accurate billing, etc, integrating with customer accounting systems, … SC can influence DSO and DPO by negotiating terms of sale, e.g., when title transfers, mode of delivery, etc. We will mainly focus on Inventory. How can SC influence Inventory? Discussion 50
Utilization of Capital Equipment Sometimes at the expense of working capital – See “The Goal” Recent story: Intel SC Transformation http://www.supplychainbrain.com/content/headline-news/single-article/article/through-its-complete-cultural-shift-intel-takes-top-spot-in-supply-chain-innovation-awards/ Fixed Asset Utilization Not required Required 51