PHYSICS
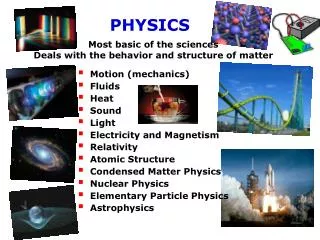
PHYSICS. Most basic of the sciences Deals with the behavior and structure of matter. Motion (mechanics) Fluids Heat Sound Light Electricity and Magnetism Relativity Atomic Structure Condensed Matter Physics Nuclear Physics Elementary Particle Physics

PHYSICS
E N D
Presentation Transcript
PHYSICS Most basic of the sciences Deals with the behavior and structure of matter • Motion (mechanics) • Fluids • Heat • Sound • Light • Electricity and Magnetism • Relativity • Atomic Structure • Condensed Matter Physics • Nuclear Physics • Elementary Particle Physics • Astrophysics
How is Science Practiced? Aim – search for order and understanding in our observations of the world around us Scientific Method Hypothesis Observation Theory Test
Science is NOT just a mechanical process of collecting facts and making theories It is a CREATIVE PROCESS
Observation Scientists can never include everything in their examination Need to use imagination and judgment about what is relevant Science is NOT an entirely objective activity Example Interpretation of motion along a horizontal surface Aristotle (384-322 BC) Galileo (1564-1642)
Theory Theories are never derived directly from observations Theories are inspirations that come from the creativity of the human mind Examples • Atomic Theory of Matter • Copernicus’ Heliocentric Theory • Theory of Relativity • Electromagnetic Theory of Light • Newtons Law of Universal Gravitation
Testing a Theory Often it is not possible to test a theory directly Rather it is tested by determining if its predictions are supported by experiment in specific and controlled circumstances. Theory Discard or modify Test predictions Experimentally Theory Accepted and Reported (NOT verified) Disagreement Agreement
Science and the Humanities Science is NOT just a mechanical process but a CREATIVE PROCESS The sciences and arts are much more alike than different
Similarities Arts Sciences • integral part of our culture • Looks at the world seeking relationships. Interprets ideas on canvas, marble … • Artistic work does NOT represent exactly everything they see/think. Judgment is used to emphasize • integral part of our culture • Looks at the world seeking relationships. Interprets ideas by creating theories • Theories do NOT include everything. Judgment used to emphasize what is relevant.
Differences Arts Sciences • Artist does not have to conform. Novelty for its own sake is legitimate • Two artists can view same subject and come up with 2 different creations, each valid. • Critique/testing – artist does not seek approval • Scientist is constrained to conform to other scientific observations • Goal is a single, unified view of nature • Critique/testing – scientist must seek approval and confirmation of ideas
Accepting a Theory Discard or modify Theory HOW CLOSE ? Test predictions Experimentally Theory Accepted and Reported (NOT verified) Disagreement Agreement
How is Science Practiced? MEASUREMENTS lie at the heart of all scientific endeavors No measurement is exact
Two issues must be confronted when performing a measurement: • the possibility of error during the measurement • some unavoidable uncertaintyin the measurement. the difference between a measured value and the true or accepted value Systematic errors that can be eliminated Random errors that can be reduced but not eliminated
Error - Difference between a measured value and the true or actual value. It is a measure of the accuracy of a measurement
Error – makes sense only when an actual value is known. If instead there is only an accepted measured value (with its own uncertainty)
Sources of Error • Systematic errorsconsistently cause measurement to be either too large or too small (mis-calibrated balances, inaccurate metersticks /stopwatches, improper equipment use, incorrect conversion of units, …)can be eliminated if known • Random errorsvariations in measurements that have no pattern. Random errors cause uncertainty in measurements (reaction time, reading a scale, …)can be reduced but never eliminated
“Any measurement that you make without the knowledge of its uncertainty is completely meaningless.” Professor Walter Lewin MIT
“Scientific knowledge is a body of statements of varying degrees of certainty — some most unsure, some nearly sure, but none absolutely certain.” Richard Feynman
Do Now • Time intervals measured with a stopwatch typically have an uncertainty of about 0.2 seconds due to random errors. • List some causes of random error in using a stopwatch to measure the time it takes an object to move from one position to another. • What is the percent uncertainty of a handtimed measurement of (A) 5 seconds, (B) 50 seconds and (C) 5 minutes? • - What does this tell you about HOW you could change your experimental technique to reduce percentage uncertainty? A) 4.0% B) 0.4% C) 0.067% Measure large time intervals
ESTIMATING Experimental Uncertainty • When only a single measurement is taken, uncertainty must be estimated. • The precision in any single measurement is limited by the smallest division on the scale. (eg.the smallest division on a meter stick is 1 mm or 0.1 cm) • Sometimes the uncertainty will be the smallest division, sometimes smaller. Estimating the uncertainty is at the discretion of the measurer.(eg.For the meter stick, if you divide the smallest 1mm division into 2 imaginary ones, your uncertainty would be 1mm÷2 = 0.5 mm)
Example • When only a single measurement is taken, uncertainty must be estimated. Estimate1 21.08 cm max 21.10cm / min 21.06cm Unc = ± 0.02cm (each 1mm division broken into 5 imaginary ones: 1mm÷5 = 0.2 mm) Estimate2 21.08 cm more subjective to break each division into 2: 1mm÷2 = 0.5 mm Unc = ± 0.05cm Edge of book: between 21.0 and 21.1 cm
Uncertainty in Multiple Measurements An alternate method of determining uncertainty is to take multiple measurements and use statistical methods to calculate the standard deviation The uncertainty of a measurement can be reduced by repeating a measurement many times and taking the average. The individual measurements will be scattered around the average. The amount of spread of individual measurements around the average value is a measure of the uncertainty.
62 63 64 65 66 67 68 Avr = 65.36 cm Larger spread or uncertainty Same average values Smaller spread or uncertainty The spread of the multiple measurements around an average value represents the uncertainty and is called the standard deviation, STD.
68% confidence that another measurement would be within one STD of the average value. 90% confidence that another measurement would be within two STDs of the average value. 95% confidence that another measurement would be within three STDs of the average value. (between 5.1-8.9) (between 3.2-10.8) (between 1.3-12.7)
Standard Deviation, STD The uncertainty of individual measurementsin a sample of repeated measurements Standard Error of the Mean, SEM The uncertainty of the average value in a sample of repeated measurements. This is the uncertainty used when comparing an average measurement to an accepted value.
68% confidence that the average value is within one SE. 90% confidence that the average value is within two SEs. 95% confidence that the average value is within three SEs. (between 6.4-7.6) (between 5.8-8.2) (between 5.2-8.8)
Example Does your measurement agree with the accepted value? YES since within 2 SEs of uncertainty, your measured average agrees with the accepted value. You have 90% confidence that the measured average value is within two SEs (between 5.8 – 8.2). What is the relative error of your measurement?
DO NOW • You did an experiment to measure the acceleration due to gravity, g, by dropping a ball from different heights and measuring the time of fall with a stopwatch. After many measurements, you found that g = 8.8 m/s ± 0.7 m/s (SE) • List some systematic errors that you could take care to minimize • List some random errors • What is the relative SE? • The accepted value of g is 9.8 m/s. Does your measurement agree with the accepted value within the uncertainty of one SE? Within two SE? • Indicate with a 90% confidence level the range of g that you measured • What is the value of the error in your experiment? • What is the value of the relative error in your experiment? 8.0% No, Yes 7.4 – 10.2 m/s 1m/s 10.2%
Summary • You have learned that there is experimental uncertainty and error in every measured quantity. • You have learned how experimental uncertainties and errors arise from random and systematic errors, respectively • You have learned some ways to estimate experimental uncertainty (STD, SE, instrument precision) and error (comparison to accepted values)
Experimental Design http://phet.colorado.edu/sims/pendulum-lab/pendulum-lab_en.html
Experimental Design • Purpose? • Determine relationship between two different variables • Controlled Experiments • Manipulate only one variable in an experiment • Observe its effect on a second variable • Hold ALL other variables in the experiment CONSTANT
Variables • Any factor that might affect the behavior of an experiment. • Independent Variables • Factor that is changed or manipulated during the experiments • Always plotted on the x-axis • Time is usually the independent variable • Dependent Variables • Factor that depends on the independent variable • Always plotted on the y-axis
Recording Data • Raw data is recorded in a data table immediately as it is collected in the lab. • Data Table • Independentvariable in leftmost column of the data table • Every column is labeled with the name of the variable being measured with the units in parentheses below the variable name. • Values in table do not have units. • Same number of decimal places in each column • Construct data table before collecting the data
Preparing the Data • Raw data might have to be “prepared” before graphing • If multiple trials were done, average the trials together to determine a representative value. • An entry in your formal table that is a result of a calculation must include an explanation of the column and a SAMPLE CALCULATION
Graphing Data • Graph the relationship between independent and dependent variables • Interpret graphs • Recognize common relationships in graphs
Graphing Data • Purpose • Determine relationship between two variables • Plot data as scatter graphs (do not connect the data points) • Graphs • Always include Title: DEPENDENT variable vs. INDEPENDENT variable • Label each axis with the QUANTITY and the UNITS • Connect the data points with a line of best fit to show the relationship between variables
Graphing Data Title y vs. x Direct Relationship Dependent variable Independent variable
Graphical Analysis • Four Basic Relationships • No relation • Linear Relations (Direct Relationship) • Square Relations • Inverse or Hyperbolic Relations • Develop mathematical model • Equation
No Relation • Changing the independent variable has NO effect on the dependent variable. • The dependent variable stays the same • Graph is a horizontal line • Slope = 0 • Equation:
Linear Relation • Graph forms straight line with nonzero slope • Equation: y = mx + b • m is the slope of the line • Can be positive or negative • b is the y-intercept
Square Relations • Non-Linear • Parabolic or Quadratic • Top/bottom opening parabolas • Equation: y = ax2 + bx + c • If vertex is at the origin (0,0), then y = ax2 • Side opening parabolas: • Linearize the graph to determine whether or not the graph is truly a parabola
Power Relations y = ax3 y = ax2 +bx y = ax1/2
Linearize y = ax2 y vs x y vs x2
Inverse Relations (hyperbolic) • As the independent variable increases the dependent variable decreases • Equation:
Inverse Relations (hyperbolic) Square Relations (Power) y = ax2 +bx y = ax3 y = ax1/2
Linearize y = a/x y vs x Plot what??
Linearizing Graphs • Manipulate the data according to the relation you think it might be • If you have predicted the right relation and manipulate it accordingly, it will result in a linear graph • Test Plot: • graph made with mathematically manipulated data for the purpose of testing whether or not our guess about a mathematical relation might hold true