Download
1 / 20
200 likes | 220 Vues
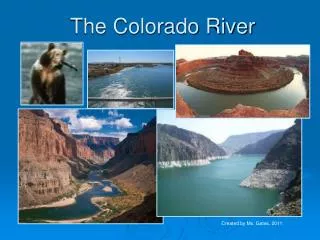
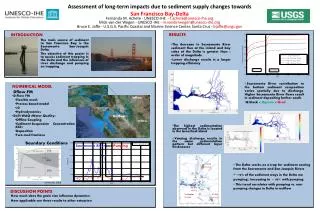
This article discusses the scientific background and impacts of high-flow experiments (HFEs) released from Glen Canyon Dam on the Colorado River. It explores the changes in flow regime and sediment supply caused by dams and the resulting effects on the river channel. The article also examines the effectiveness of HFEs in mitigating these impacts and the challenges faced in maintaining sand supply in the Grand Canyon.

E N D
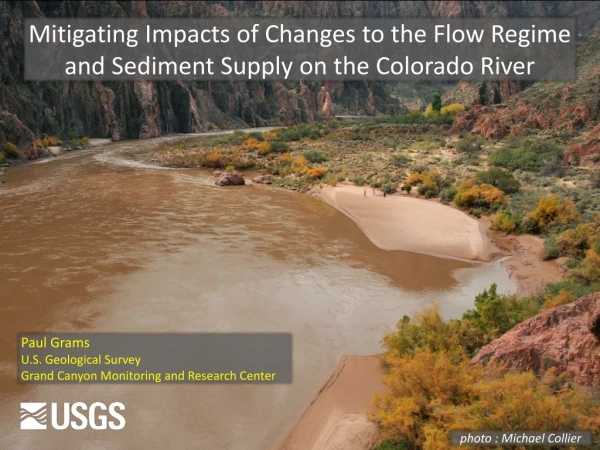
Mitigating Impacts of Changes to the Flow Regime and Sediment Supply on the Colorado River • Paul Grams • U.S. Geological Survey • Grand Canyon Monitoring and Research Center photo : Michael Collier
“redesign of the river channel with dam operations” Mitigating Impacts of Changes to the Flow Regime and Sediment Supply on the Colorado River • Paul Grams • U.S. Geological Survey • Grand Canyon Monitoring and Research Center photo : Michael Collier
Overview Scientific background for high-flow experiments (HFEs) released from Glen Canyon Dam. How do HFEs work? What has been the response to repeat HFEs? What HFEs do and do not accomplish?
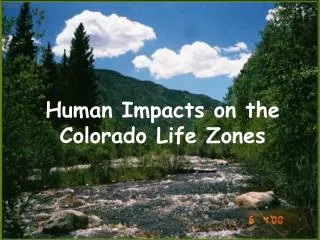
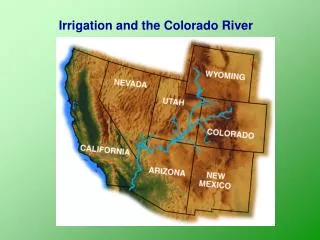
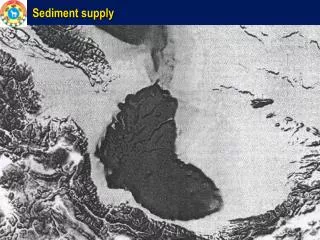
Flow and Sediment Disruptions in the Colorado River Basin • Water sourced from the high-elevation mountains • Fine sediment enters the river in the low-elevation basins • All dams disrupt the flow of water • The effect of each dam on fine-sediment transport depends on its location in the basin
Decline in magnitude of annual flood throughout basin Greendale Green River Cisco Lees Ferry
Lower floods narrower channel Brown’s Park, Utah 1952 Glen Canyon, Arizona 1871 1911 1998 1958 2008 1999 Grand Canyon, Arizona 1999 Canyonlands, Utah
Colorado Plateau tributaries add sediment without adding much water, causing variable impact below dams • Upper Green River: Sand-bedded reaches, far downstream from Flaming Gorge Dam • Channel-narrowing with no bed incision and segments of fine-sediment accumulation • Glen Canyon: Sand-bedded reach, immediately downstream from Glen Canyon Dam • Channel-narrowing with bed incision • Marble Canyon: Debris-fan dominated reach, far downstream from Glen Canyon Dam • Channel-narrowing with sandbar erosion
Below Glen Canyon Dam: Sediment budget affected by disruption of sand supply and change in flow regime Paria River Glen Canyon Dam Marble Canyon ~ 6% of pre-dam sand supply Colorado River at Lees Ferry, AZ Little Colorado River Grand Canyon ~ 16% of pre-dam sand supply 85 to 95% reduction in supply coupled with ~20% reduction in mean annual flow sediment deficit Topping et al. (2000)
RM: 0-8 RM: 29-35 RM: 42-49 RM: 50-56 RM: 60-72 Pre-dam Post-dam I Ratio of observed sandbar area to maximum potential sandbar area (reach-average) 1935 1965-1996 1996-2009 1935 1965-1996 1996-2009 1935 1965-1996 1996-2009 1935 1965-1996 1996-2009 1935 1965-1996 1996-2009 • Pre-dam: • Annual floods • Abundant sand supply • Large sandbars • Post-dam I: • Daily small floods • Limited sand supply • Eroding sandbars • Unplanned floods (spills) About 25% reduction in sandbar area in Marble Canyon (Schmidt et al., 2004; Ross and Grams, 2015) 1952 2003
Pre-dam Post-dam I • Post-dam II: • Restricted hydropower operations • High Flow Experiments (HFEs) • triggered by sand supply from Paria River • Science and Management Questions: • With frequent HFEs, will sandbars increase in size and abundance? • Will frequent HFEs cause sand supply in channel to decrease and exacerbate sediment deficit? • Pre-dam: • Annual floods • Abundant sand supply • Large sandbars • Post-dam I: • Daily small floods • Limited sand supply • Eroding sandbars • Unplanned floods (spills) Pre-HFE Post-HFE
What are the high-flow experiments (HFEs) doing? Eroded sandbar before HFE HFE inundates sandbar Debris Fan Sandbar following HFE HFEs transfer sand from channel and low-elevation parts of eddies to sandbars along channel margins
November 2016 High-flow Experiment Sandbar Deposition River Mile (RM) 119 R HFE Deposition 11/07/2016 11/13/2016 River Mile (RM) 122R HFE Deposition 11/07/2016 11/13/2016
November 2016 High-flow Experiment Sandbar Deposition 11/06/2016 HFE Deposition filling gullies 11/13/2016 River Mile (RM) 23L
What are the HFEs doing? 11/17/2014 5/7/2015 9/23/2015 Most sandbars erode near pre-HFE size within 6 to 12 months.
What are the HFEs doing? • Consistently rebuilding sandbars • Sandbars consistently erode following HFEs • But, sandbars are consistently larger than in periods without the HFEs • Erosion continues in years without HFEs
Will HFEs continue to be effective? Sand Supply in Grand Canyon: 2012-2017 Paria River • Alternating segments of significant sand accumulation and erosion • Overall accumulation (but not significant) No evidence for overall net evacuation or accumulation • Depends on continued sand inputs from Paria and Little Colorado rivers • Depends on frequency of years of high release volume (equalization years) that export more sand + 5.9 ± 3 million metric tons sand accumulation Glen Canyon Dam + 2 ± 5 million metric tons net balance Little Colorado River - 3.9 ± 2 million metric tons sand erosion
What are the HFEs not doing? • Not depositing sandbars substantially larger than observed in past HFEs? • Not depositing sandbars at substantially more locations than observed in past HFEs. • Response likely constrained by HFEs that are all within narrow range of magnitude and duration. • Response may also be constrained by hydrograph shape. 1996 2004 2008 2012 Example at one site: each HFE built a large sandbar • Bar volume largest in 1996 (highest discharge and longest duration) • Bar area largest in 2012 (more gradual downramp) • Bar less steep in 2012 (more gradual downramp)
What are the HFEs not doing? RM 194 L • Not depositing sandbars substantially larger than observed in past HFEs? • Not depositing sandbars at substantially more locations than observed in past HFEs. • Response likely constrained by HFEs that are all within narrow range of magnitude and duration. • Response may also be constrained by hydrograph shape. • Not removing vegetation or causing channel width to increase • not managing for segments in sediment surplus. 4/20/1996 11/20/2016
Are dam operations a “tool” for channel design? HFEs result in sandbar deposition that does not occur during normal operations. Because sandbars inevitably erode, they are only effective if repeated and if sand supply is maintained. 1958 2008-2017 But, HFEs as currently implemented, are not expected to recreate pre-dam conditions