Investing WisdomTree Quarterly Sector Attribution Trends
60 likes | 154 Vues
Analyzing DLN performance attribution for the first quarter of 2012. Learn about allocation, selection, and interaction effects on sector returns. Understand the risks and considerations associated with sector-focused investments.

Investing WisdomTree Quarterly Sector Attribution Trends
E N D
Presentation Transcript
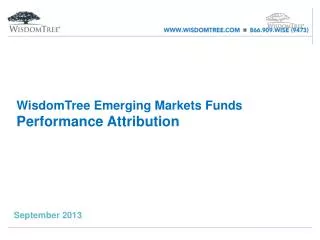
WisdomTreeLargeCap Dividend Fund Performance Attribution March 2012
DLN Standardized Performance Standardized Performance as of March 31, 2012 Source: Morningstar, WisdomTree Performance is historical and does not guarantee future results. Current performance may be lower or higher than quoted. Investment returns and principal value of an investment will fluctuate so that an investor's shares, when redeemed, maybe be worth more or less than their original cost. Performance data for the most recent month-end is available at www.wisdomtree.com. WisdomTree shares are bought and sold at market price (not NAV) and are not individually redeemed from the Fund. Total Returns are calculated using the daily 4:00 p.m. EST net asset value (NAV). Market price returns reflect the midpoint of the bid/ask spread as of the close of trading on the exchange where Fund shares are listed. Market price returns do not represent the returns you would receive if you traded shares at other times. You cannot invest directly in an index. The S&P 500 Index measures the performance of the Large Cap U.S. equities. The index includes 500 leading companies in leading industries of the U.S. economy, capturing 75% coverage of U.S. equities. The Russell 1000 Value Index measures the performance of the large-cap value segment of the U.S. equity universe. It includes those Russell 1000 Index companies with lower price-to-book ratios and lower expected growth values.
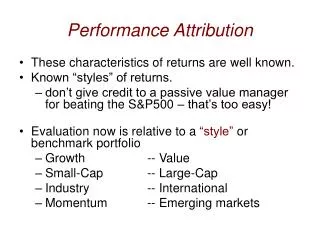
DLN 1st Quarter GICS Sector* Attribution: 3/31/2012 Holdings are subject to change. Past performance is not indicative of future results. *Sectors may contain many industries. 1 Allocation effect represents the portion of the return that was attributed to being over or underweight a particular sector. 2 Selection effect represents the portion of the return that was attributed to the positive or negative stock selection within the sector. 3 Interaction effect represents the portion of the total return that can neither be attributed to the allocation effect nor the selection effect. 4 The total effect represents the combined effect of the allocation , select, and interaction effects on the total return.
DLN Sector* Attribution 1- Year: 3/31/2011 to 3/31/2012 Holdings are subject to change. Past performance is not indicative of future results. *Sectors may contain many industries. 1 Allocation effect represents the portion of the return that was attributed to being over or underweight a particular country. 2 Selection effect represents the portion of the return that was attributed to the positive or negative stock selection within the country. 3 Interaction effect represents the portion of the total return that can neither be attributed to the allocation effect nor the selection effect. 4 The total effect represents the combined effect of the allocation , select, and interaction effects on the total return.
DLN Since Inception Sector* Attribution (as of 3/31/2012) Holdings are subject to change. Past performance is not indicative of future results. *Sectors may contain many industries. 1 Allocation effect represents the portion of the return that was attributed to being over or underweight a particular sector. 2 Selection effect represents the portion of the return that was attributed to the positive or negative stock selection within the sector. 3 Interaction effect represents the portion of the total return that can neither be attributed to the allocation effect nor the selection effect. 4 The total effect represents the combined effect of the allocation , select, and interaction effects on the total return.
Important information There are risks associated with investing, including possible loss of principal. Funds focusing their investments on certain sectors increase their vulnerability to any single economic or regulatory development. This may result in greater share price volatility. Please read the Fund’s prospectus for specific details regarding the Fund’s risk profile. Investors should carefully consider the investment objectives, risks, charges and expenses of the Fund’s before investing. To obtain a prospectus containing this and other important information, please call 1-866-909-WISE (9473) or visit wisdomtree.com to view a prospectus online. Read the prospectus carefully before you invest. The Global Industry Classification Standard (“GICS”) was developed by and is the exclusive property and a service mark of Morgan Stanley Capital International Inc. (“MSCI”) and Standard & Poor’s(“S&P”), a division of The McGraw-Hill Companies, Inc. and is licensed for use by WisdomTree Investments, Inc. Neither MSCI, S&P nor any other party involved in making or compiling the GICS or any GICS classifications makes any express or implied warranties or representations with respect to such standard or classification (or the results to be obtained by the use thereof), and all such parties hereby expressly disclaim all warranties of originality, accuracy, completeness, merchantability and fitness for a particular purpose with respect to any such standard or classification. Without limiting any of the foregoing, in no event shall MSCI, S&P, any of their affiliates or any third party involved in making or compiling the GICS or any GICS classifications have any liability for any direct, indirect, special, punitive, consequential or any other damages (including lost profits) even if notified of the possibility of such damages. WisdomTree Funds are distributed by ALPS Distributors, Inc. WIS004099 4/2013