Adviser: Dr. Jay Parrish
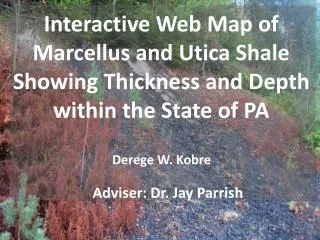
Interactive Web Map of Marcellus and Utica Shale Showing Thickness and Depth within the State of PA. Adviser: Dr. Jay Parrish. Derege W. Kobre. INTRODUCTION. Objective? Why I have chosen this project ? Who will benefit from the project ? What is Marcellus Shale and why it is important?

Adviser: Dr. Jay Parrish
E N D
Presentation Transcript
Interactive Web Map of Marcellus and Utica Shale Showing Thickness and Depth within the State of PA Adviser: Dr. Jay Parrish Derege W. Kobre
INTRODUCTION • Objective? • Why I have chosen this project ? • Who will benefit from the project ? • What is Marcellus Shale and why it is important? • What is Utica Shale and why it is important?
INTRODUCTION • The recent change in drilling and production • What is Horizontal Fracking ? • What is Hydraulic Fracking ? • What is the estimated resource from the Marcellus Shale? • What is the estimated resource from the Utica Shale? Vertical Fractures Or Pores
WORKFLOW SOURCE DATA EXCEL SPREAD SHEET FILE FORMAT GEOSTATISTICAL ANALYSIS ArcGIS DESKTOP TEXT & TABLE FILE FORMATS(.csv and .dbs for geometry and attributes respectively) ACCESS MySQL SERVER PHP XML FILE FORMAT WEB DEVELOPMENT CLIENT
METHODOLOGY • Source Data (EXL Spread Sheet) • MWELLHEADER.xls • Marcellus_tops.xls • Utica_tops.xls • Algorithm • Data Preparation (ACCESS database)
METHODOLOGY • Source Data (EXL Spread Sheet) • Algorithm • Data Preparation (ACCESS database) • query1 is created from the joined MWELLHEADER table and Marcellus_tops table based on UWI and MTOP values (1795 RETURNS) • query2 is created from the joined MWELLHEADER table and Marcellus_tops table based on UWI and MBOT values (1753 RETURNS) • query3 is created to change query1 to a table named WELLMTOP • Create query4 that will change query2 to a table named WELLMBOT
METHODOLOGY • Source Data • Algorithm • Data Preparation (ACCESS database) • Geoprocessing (ArcGIS) • Add coordinate data to the MWELLHEADER table (x y events) & save as a shapefile • Join the rest of the table to it to include the fields MTOP and MBOT and name the combined shapefile WELLCOMB • Add the fields MTHICK and MDEPTH • Use the field calculator to update the records (e.g MTHICK = [MBOT]-[MTOP] )
Geoprocessing (ArcGIS) • Do Geostatistical Analysis from Geostatistical Wizard using Kriging method for each fields to create a prediction map layer of polygon shape • export the kriging layer to vector data • Confirm that "GA Layer To Contour" dialogue box pops up allowing to make a polygon shape file of filled contours that showed both the prediction map and prediction standard error map for each field • Use Natural Neigbour method for the Utica data • Reclassify raster output • Change raster to polygon
Geoprocessing (ArcGIS) • Export the shapefiles out to Access database. • MWELL.shp • UWELL.shp • MTHICK.shp • MDEPTH.shp • MTHICKERR.shp • MDEPTHERR.shp • Uthick.shp • Udepth.shp • The shapfiles are exported out in two forms • Text (use export shapefile to csv tool created by Jim Detwiler from my toolbox) Note: to append the geometry data • Table (dbase IV) Note: to append the attributes
METHODOLOGY • Source Data • Algorithm • Data Preparation (ACCESS database) • Geoprocessing (ArcGIS) • Create Tables (MySQL database) • Form XML data using PHP server side scripting language
METHODOLOGY • Source Data • Algorithm • Data Preparation (ACCESS database) • Geoprocessing (ArcGIS) • Create Tables (MySQL database) • Form XML data using PHP server side scripting language
METHODOLOGY • Source Data • Algorithm • Data Preparation (ACCESS database) • Geoprocessing (ArcGIS) • Create Tables (MySQL database) • Form XML data using PHP server side scripting language • Create the point and polygon maps using Google Engine, HTML and JavaScript client side programming language • Repeat the above two steps for each layer
CONCLUSION • Challenges • Improving result with more data • Future prospect in improved methodology • Sample demonstration • Paper
REFERENCES • David O'Sullivan, P., & Unwin, D. J. (2010). Geographic Information Analysis (2nd ed.). New Jersey: John Wiley & Sons, Inc. • King, H. (n.d.). Marcellus Shale - Appalachian Basin Natural Gas Play. Retrieved 12 01, 2013, from Geology.com: http://geology.com/articles/marcellus-shale.shtml • Maps and Digital Data. (n.d.). Retrieved from DCNR Pennsylvania Department of Conservation and Natural Resources: http://www.dcnr.state.pa.us/topogeo/econresource/oilandgas/marcellus/marcellus_maps/index.htm • MCOR. (n.d.). Resources : Maps & Graphics. Retrieved 2 3, 2014, from Penn State Marcellus Center for Outreach and Research : http://www.marcellus.psu.edu/resources/maps.php • NETL. (2007, 1 31). Natural Gas Program Archive. Retrieved from U.S. Department of Energy: Office of Fossil Energy: National Energy Technology Laboratory: http://www.netl.doe.gov/KMD/Forms/CdDvdRetrieval.aspx • Pictures of the Marcellus Shale formation outcrop . (n.d.). Retrieved 12 7, 2013, from WV Surface Owners’ Rights Organization (WV SORO): http://www.wvsoro.org/resources/marcellus/surface_pictures.html
QUESTIONS? Your comments and feedbacks are appreciated