Transit Sustainability Project
220 likes | 399 Vues
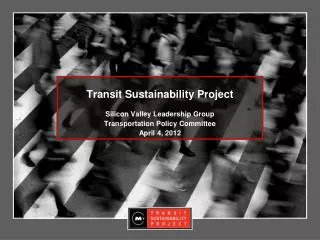
Transit Sustainability Project. Silicon Valley Leadership Group Transportation Policy Committee April 4, 2012. Project Context. 2. Challenge for Bay Area Transit System. Projected Deficits Transportation 2035. Opportunity for Bay Area Transit System.

Transit Sustainability Project
E N D
Presentation Transcript
Transit Sustainability Project Silicon Valley Leadership Group Transportation Policy Committee April 4, 2012
Challenge for Bay Area Transit System Projected Deficits Transportation 2035
Opportunity for Bay Area Transit System • Bay Area seeks to focus growth around transit • Plan Bay Area forecast growth in Priority Development Areas: • 74% new housing • 67% new jobs • More intense development near high quality transit
What is Important for Transit’s Success? • Improve financial position:Contain costs, cover a greater percentage of operating and capital costs with a growing share of passenger fare revenues; secure reliable streams of public funding. • Improve service for the customer:Strengthen the system so that it functions as an accessible, user-friendly and coordinated network for transit riders, regardless of mode, location or jurisdiction. • Attract new riders to the system:Strengthen the system so that it can attract and accommodate new riders in an era of emission-reduction goals, and is supported through companion land use and pricing policies. 5 5
Efforts to Strengthen the Bay Area Transit System Financial Position: Significant efforts by transit management and labor to stem cost increases in last several years Customer Service: Focused service performance efforts in areas of the region Coordination and collaboration yield benefits for customers Attracting new riders: Plan Bay Area calls for land use patterns that rely heavily on transit service Pricing policies 6
How can the Bay Area Continue to Improve? Control costs Reinvest savings in service Build public confidence Attract additional revenue Invest strategically to improve customer experience and attract more passengers Interagency initiatives focused on the customer and cost reductions 7
Financial Performance Goal – Strengthen the system so that it can cover its operating and capital costs with a growing share of passenger fare revenues as well as reliable streams of public funding. 8
Bay Area Large Operators: Percent Change in Cost and Performance Indicators (1997 – 2008) Source: National Transit Database, “Big 7” only. Excludes ferry, cable car and paratransit.
Establish Performance Framework Financial targets would be set compared to the highest cost per hour experienced by each agency between 2008 and 2011. Note that 5% would include savings from labor agreements since 2008. Based on evaluation and possible savings in areas including: Fringe Benefits Work Rules and Business Model Administrative Costs 10 10 10 10
Some Operators are on Track: Cost per Hour • Data from TDA submittals; except SamTrans FY 2010-11 (audited actuals), Caltrain from CAFRs and NTD reports • FY2011-12 data will be revised to reflect audited final numbers 11 11 11
Some Operators on Track: Cost Per Passenger • Data from TDA submittals; except SamTrans FY 2010-11 (audited actuals), Caltrain from CAFRs and NTD reports • FY2011-12 data will be revised to reflect audited final numbers 12 12 12
Operators to Chart Performance Roadmap • Existing and new operating and capital funds administered by MTC may be linked to progress towards target
Potential New Revenues Regional Gas Tax Subject to 2/3 voter approval, MTC may impose a gas tax not to exceed 10 cents per gallon (10 cent gas tax = ~$250 million/year) Regional Gas Tax Poll underway - results available in March Support Local Measures that are consistent with TSP goals and objectives (e.g. Alameda County Reauthorization – proposed $3.7 billion for transit) 14 14 14
Service Performance Goal – Strengthen the system so that it functions as an accessible, user-friendly and coordinated network for transit riders, regardless of mode, location or jurisdiction. 15
Establish the Transit Performance Initiative • Propose an investment and incentive approach to achieve improved service performance • Investment • Regional investment in supportive infrastructure to achieve performance improvements in major transit corridors - $30 million pilot program of projects scheduled for approval with April TSP adoption • Incentive • Reward agencies that achieve improvements in ridership and service productivity 16
Functional Consolidation: Capital Planning and Resource Sharing • Expand regional capital project planning/design to include sharing existing expertise (e.g., BRT) and facilities (e.g., maintenance shops) • Formalize joint procurement of services and equipment through regional resource centers • Reduce number of contracts • Achieve economies of scale • Examples: SANDAG, Toronto, Metrolinx • Examples: Metrolinx Bay Area Transit System: 3,200 Buses 1,200 Rail Cars 1,200 miles of rail 4. Proposed Institutional Recommendations 18
Functional Consolidation: Service Planning • Use county or subregion-level SRTPs to promote interagency strategic planning • Include performance metrics/targets • Include institutional elements and timeline • Integrate bus/rail scheduling software to facilitate schedule coordination and customer travel planning • Standardize schedule changes for service planning • Automatically update transit operators’ information and traveling public’s access to most recent information 4. Proposed Institutional Recommendations 19
Strengthen Coordination Among Small Operators Strategy Areas Coordination Opportunities • Fare • Capital & Service Planning • Customer Service Uniform eligibility/fares for transfers, discounts County-based SRTPs/joint purchase requirements Joint call centers/marketing 20
Institutional Consolidation • Complete existing consolidations: • SolTrans • Ferries (Vallejo, Alameda-Oakland, and Harbor Bay) • Apply lessons learned from consolidation of transit services in Solano and Napa in considering benefits of institutional consolidation among smaller operators elsewhere. • Consider integration of multiple transportation functions such as transit operating, planning and sales tax authority when appropriate (e.g. VTA, ACTC) 4. Proposed Institutional Recommendations 21
Transit Sustainability Project Recommendations Financial – Establish performance framework to reduce Operating Cost per Service Hour* by 5% within 5 years and no growth beyond CPI thereafter Service – Transit Performance Initiative Investment Incentive Institutional Functional Consolidation Strengthen coordination among small operators Institutional Consolidation - complete work in progress and apply lessons learned to future decision making *Operators may choose Op Cost per Passenger or Op Cost per Passenger-Miles for performance metric 22