Download
1 / 26
260 likes | 444 Vues
2006 Census of Canada. Immigration in Canada: A Portrait of the Foreign-born Population. December 4, 2007. Canada has welcomed over 1 million immigrants during the first five years of the millennium . 2002: Immigration and Refugee Protection Act.

E N D
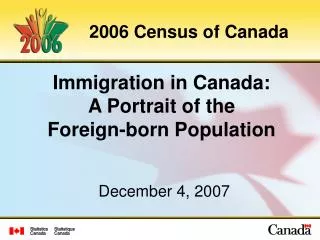
2006 Census of Canada Immigration in Canada: A Portrait of the Foreign-born Population December 4, 2007
Canada has welcomed over 1 million immigrants during the first five years of the millennium 2002: Immigration and Refugee Protection Act Source: Citizenship and Immigration Canada.
One in five were foreign-born, highest proportion in the population in 75 years since 1931 Sources: Statistics Canada, censuses of population, 1901 to 2006.
Canada’s proportion of foreign-born is lower than the Australia, but higher than the United States Sources: Statistics Canada, Census of population, 2006. Australian Bureau of Statistics, 2006 Census. United States Census Bureau, 2006 American Community Survey.
Top reasons for choosing to come to Canada Improve future for family Join family or close friends Education opportunity Top reasons for staying permanently Quality of life Positive future prospects for family To be close to family and friends Family is the reason why many come and quality of life is why many remain 4 years later Sources: Longitudinal Survey of Immigrants to Canada, Waves 1 & 3.
Most recent immigrants came from Asia, but its share was unchanged since 2001 Region of birth of recent immigrants (in Canada up to 5 years prior to Census year), 1971 to 2006 Sources: Statistics Canada, censuses of population, 1971 to 2006.
The majority of the recent immigrants (85.8%) lived in Ontario, Quebec and British Columbia Source: Statistics Canada, Census of population, 2006.
Ontario and British Columbia had a higher share of recent immigrants than their population share 1.00 Equal share of recent immigrants to the share of the total population Source: Statistics Canada, Census of population, 2006.
Toronto has long been the major destination for recent immigrants, but some other urban centres (e.g., Calgary) have increased their share Sources: Statistics Canada, censuses of population, 1981 to 2006.
1.00 Equal share of recent immigrants to the total population Some urban centres such as Toronto and Vancouver received a higher share of newcomers than their population share in 2006. But there was a shift from 2001, with Calgary and Montréal receiving a higher share Relative ratio of recent immigrants to total population of the given CMA, 2006 relative ratio Sources: Statistics Canada, censuses of Population, 2001 and 2006.
Toronto and Vancouver led many of the largest metropolitan areas in the proportion of the foreign-born population Sources: Canadian cities – Statistics Canada, 2006 Census. United States cities – US Census Bureau, 2005 American Community Survey; Australian cities, 2006 Census.
In 2006, over 20% of the population in some CMAs, such as Hamilton, Abbotsford, Calgary, Windsor and Kitchener, were foreign-born Source: Statistics Canada, Census of population, 2006.
Recent immigrants were more likely to settle in the city of Toronto, Mississauga and Brampton Source: Statistics Canada, Census of Population, 2006.
A majority of the population in certain municipalities in Toronto CMA was foreign-born Top 10 municipalities in the Toronto CMA where recent immigrants settled in 2006 Source: Statistics Canada, Census of Population, 2006.
In the Montréal CMA, the majority of the recent immigrants lived in the City of Montréal Percentage recent immigrants and the total population in selected municipalities in Montréal CMA, 2006 Source: Statistics Canada, Census of Population, 2006.
Three in 10 of the residents in the city of Montréal were foreign-born Top 10 municipalities in the Montréal CMA where recent immigrants settled in 2006 Source: Statistics Canada, Census of Population, 2006.
Three-quarters of the newcomers in Vancouver CMA lived in just four municipalities: the city of Vancouver, Surrey, Burnaby and Richmond Percentage recent immigrants and the total population in selected municipalities in Vancouver CMA, 2006 Source: Statistics Canada, Census of Population, 2006.
Almost six in 10 of the residents in the municipality of Richmond were foreign-born Top 10 municipalities in the Vancouver CMA where recent immigrants settled in 2006 Source: Statistics Canada, Census of Population, 2006.
There was a diversity of origin countries, but the People’s Republic of China and India were consistently among the top source countries Top 10 birthplaces of recent immigrants in Toronto, Montréal and Vancouver, 2006 Source: Statistics Canada, Census of Population, 2006.
The vast majority of the foreign-born people hold Canadian citizenship • 85.1% of eligible immigrants are Canadian citizens • 2.8% of the total population hold dual or multiple citizenships • United Kingdom, Poland and the United States are the most common countries of citizenship among the multiple-citizenship holders Canadian by naturalization 15% Not a Canadian citizen 5.6% Canadian by birth 79% Source: Statistics Canada, Census of population, 2006.
January 15, 2008: Aboriginal peoples March 4, 2008: Labour (including labour market activity, industry and occupation); Place of work and commuting to work (including mode of transportation); Education (including school attendance and educational attainment); Language (including language of work) April 2, 2008: Ethnic origin and visible minorities May 1, 2008: Income and earnings; Housing and shelter costs Upcoming 2006 Census releases