Download
1 / 31
310 likes | 461 Vues
Consultation on the levels of the limits on Tiers 1 and 2. Stephen Earl, Alex Barr MAC secretariat Universities UK 2 September 2010. The Migration Advisory Committee. Non-departmental public body set up in 2007 Provides evidence-based advice to Government on immigration issues

E N D
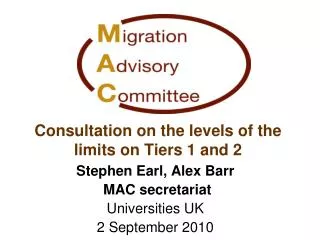
Consultation on the levels of the limits on Tiers 1 and 2 Stephen Earl, Alex Barr MAC secretariat Universities UK 2 September 2010
The Migration Advisory Committee • Non-departmental public body set up in 2007 • Provides evidence-based advice to Government on immigration issues • Immigration experts and economists • Supported by secretariat of economists, researchers and policy officials • Has advised on shortage occupation lists for Tier 2 of the Points Based System (PBS) • Government have also asked MAC to advise on other matters relating to immigration, including transitional arrangements for EU nationals and Tiers 1 and 2 of the PBS • Has most recently been asked to advise on first annual limits for Tiers 1 and 2
Membership of the MAC Professor David Metcalf CBE (Chair of the MAC) is Professor of Industrial Relations at the London School of Economics. Dr Diane CoyleOBE was an advisor to HM Treasury and economics editor of The Independent up to 2001. She is visiting Professor at the University of Manchester's Institute for Political and Economic Governance. Professor Jonathan Wadsworth works in the Economics Department at Royal Holloway College, University of London. Dr. Martin Ruhs is an economist at the ESRC Centre on Migration, Policy and Society at the University of Oxford. Professor Robert Wilson is a labour economist at the Institute for Employment Research at the University of Warwick Professor Mike CampbellOBE (ex officio member) is Director of Development at the Commission for Employment and Skills.
Previous MAC work • Shortage occupation lists for the UK and Scotland (Autumn 08; Spring 09; Autumn 09; Spring 10) • Is there an economic case for restricting PBS tier 2 to shortage occupations only? (Aug 09) • Assessment of the economic contribution made by the dependants of the PBS migrants and their role in the labour market? (Aug 09) • What further changes to the criteria for PBS tier 1 should there be in 2010/11, given the changing economic circumstances? (Dec 09) • EU immigration: Bulgaria and Romania(Dec 08); “A8” countries(Apr 09)
Current work • Spring 2010 – selected occupations – Government considering our report • Autumn 2010 full review (postponed) • Limits consultation – report by end September 2010
Question asked by Government • Coalition for Government paper on 20 May 2010 committed to introducing an annual limit on non-EU economic migrants. • Home Secretary has commissioned the MAC to advise on… “At what level should limits on Tier 1 and Tier 2 of the Points Based System be set for their first full year of operation in 2011/12, in order to contribute to achieving the Government’s aim of reducing net migration to an annual level of tens of thousands by the end of this Parliament, and taking into account social and public service impacts as well as economic impacts” …and to report by the end of September 2010. • MAC launched consultation paper asking businesses, organisations and partners to submit evidence to inform MAC advice on what the levels should be. • The MAC deadline for responses is the 7th September. • UKBA are running a consultation alongside asking partners what the mechanism should be to implement an annual limit on Tiers 1 and 2.
Historic Net Flows • Long-term International Migration from the International Passenger Survey Net inflow of EU = 63k Total net inflow = 163k Net inflow of Non-EU = 187k Net outflow of British = 87k The provisional net migration total for 2009 is 196k Source: International Passenger Survey
Flows by reason for migration, 2009 • Long-term International Migration from the International Passenger Survey Number of immigrants (000’s) Source: International Passenger Survey, 2009
PBS Visa Inflows for Tiers 1 and 2, 2009 • PBS Entry Clearance Visas • (out of country, main applicants) Total main applicants out-of-country: 55,285 Plus: Dependants: • Tier 1 and predecessor schemes = 15,015 • Tier 2 and predecessor schemes = 26,990 In-country applicants (extensions, switchers): • Tier 1 = 65,925 • Tier 2 = 20,145 Source: Control of Immigration Statistics 2009; UKBA Management Information
3 Key issues for the MAC • Criteria to be taken into account when recommending limit for Tiers 1 and 2, and how they should be balanced? • Economic (including labour market and skills)? • Public service? • Social? • Objectives consistent with aim to reduce net migration to tens of thousands over lifetime of Parliament? • 100,000 net migration, or lower? • How much from Tiers 1 and 2? • How to account for EU and British? • Trajectory,for Tiers 1 and 2, to achieve the objective? • Early relatively large reductions, then smaller ones? • Smaller followed by larger? • Approximately linear?
Consultation Questions • Objective • What trends do you expect to see in non-PBS migration? • Focus on in-country extensions and switching or new applications? • Dependant numbers reduced by proportionately more than main migrants? • Trajectory • Impact of reducing the number of main migrants through T1 general in 2011/12? • Impact of reducing the number of main migrants through T2 shortage, RLMT and ICT routes? • If proposing small or zero reductions in migration through a certain route, through which other T1 or T2 route should reductions be made? Criteria • How can the economic, public service and social impacts be measured? • How should they be balanced? • How quickly can alternatives to employing migrants be put in place (e.g. up-skilling, mechanisation)?
Economic impacts • Are there economic impacts for your region that we should take into account? Do non-EU workers fill jobs that can’t be filled from the resident labour market (e.g. chefs, engineers etc…)? • If fewer of these jobs were filled by non-EU migrants in the future, what alternatives would employers seek? • How quickly could employers put in place alternative measures?
Public service impacts • Are there public service impacts that we should take into account (e.g. education, health services, social services and housing) • What role do migrants (particularly Tier 1 and Tier 2 migrants and their dependants) play in consuming and providing these services? To what extent can you measure and balance these impacts?
Social impacts Are there social impacts that we should take into account? For example: • On crime, we want to know the extent to which migrants are victims of crime and commit crime (relative to the resident population), and what types of crime, and how much police and prison resource are “consumed”. • In relation to social cohesion, are there any regional public opinion polls on migration that we could use? • Can employers comment on the rate of change of the proportion of their workforce that are migrants? Do migrants integrate well into the workforce/local community? Have there been any tensions/disputes among employees?
PROTECT - MANAGEMENT Overall themes Reducing migration via a limit • Few are positively in favour of limits. Some support them ‘in principle’, as long as the limit does not bite on their migrant use. • Idea of an objective for migration is not well understood, in other words what is the exact target for net migration. • Notion of net migration (i.e. inflows & outflows) is better understood - some have given thought to the implications of outflows. Setting levels for a limit • Very few directly address the question of levels, many focus on issues related to UKBA consultation. • Many implicitly assume that levels will be set which don’t bite very hard in terms of preventing firms from recruiting overseas. • Many employers favour Tier 2 over Tier 1. • Most are concerned about impacts on business and consequently economy. • Little firm evidence on social impacts or public service demand side impacts. More evidence on public service supply side. • Issue of dependants is noted, consensus seems to be anything which restricts dependants more will have a negative impact on desire of main migrants to come. 16
Identification and measurement of impacts PROTECT - MANAGEMENT • Economic: • Need to rebalance economy towards investment and exports. • Reciprocity a consideration in terms of trade and exports. • UK needs to be seen as being open for business. • Firms uncertainty over the ability to recruit the right personnel may limit expansion plans. • T1 and T2 migrants often filling jobs which cannot be filled from resident labour market. • Many sectors relying on non-EEA migrants are in priority areas (e.g. engineering and technology advancements in renewable energy and healthcare) – so there are longer term implications for those sectors. • Some non-EEA migrants send a proportion of earnings back to home country – lessening the positive economic impact. • Some large cities have lost skilled and highly skilled workers – tend to move out to more wealthy areas – therefore they want to attract skilled and highly skilled migrants to help with economic growth and job creation. • Less non-EEA workers may create inflationary pressures (resident workers demanding higher pay). • In social care – fewer non-EEA workers may mean private homes will close – putting resident workers out f a job. • Fewer care places might mean more family members having to give up jobs to look after elderly relatives. 17
Identification and measurement of impacts PROTECT - MANAGEMENT • Public Service: • PBS migrants have very limited access to benefits. • Many PBS migrants are employed as providers of public services. • Health sector would suffer - large number of T1 and T2 workers. Waiting lists may increase. • Social care would suffer from both T2 limit and also impact on dependants. Fewer workers = fewer care places = more pressure on health service (e.g. bed blocking). • Tend to be young, healthy and law abiding and therefore demand is not disproportionately high (education may be the only exception). • Libraries are extensively used by migrants. This means libraries providing more diverse services. • Fewer university lecturers in certain specialities will lead to fewer graduates and fewer available employees in sectors where there is already a shortage (e.g. engineering). • When there is a rapid increase in local migrant population schools can suffer from both additional places being required, but also additional languages. Those areas which have lived with increased immigration for a while have adapted very successfully. School results will often take a dip and then start to recover as the service responds. • Diverse communities need diverse workforces to deliver frontline services. • Expensive use of translators required particularly in health service and by courts/police. • Increased fire risks associated with some low value/high density private rented accommodation occupied by migrants. 18
Identification and measurement of impacts PROTECT - MANAGEMENT • Social: • Tier 1 and 2 migrants unlikely to commit crime, but may be more likely to be the victim of crime. Also some suggestion that they are more unlikely to report crime due to negative perceptions of police. • Reduced Tier 1 and 2 migration could lead to increased illegal immigration. • Migrants contribute towards vibrant, diverse communities. They make communities more culturally rich. • Dependants often have more problems with integration due to language (although children may fair better because they have to integrate and learn language in school). • Often misconceptions about negative impacts of migration – this in itself can result in social tensions. • Some migrant communities very ‘closed’ resulting in less integration and social tension (e.g. work riders and Chinese chefs). • Can be difficult to differentiate the impacts between EEA and non-EEA migrants. • Generally non-EEA migrants will have less of a negative impact than EEA migrants. • Migrants are rejuvenating inner-city housing (streets which have been empty for years after locals left for more wealthy suburbs). Migrants moving in have helped shops and schools to stay open thereby enabling resident population to still access local services. • Often more problems when migrants move into communities where there hasn’t been a history of immigration. Areas which have had high immigration for a while have adapted well. • Impacts on housing are predominantly in private rented sector where in certain localities they can put pressure on high value rented accommodation (presumably from T1 migrants), and also low value/high density housing. • Clustering of migrant communities can cause suspicion and frustration amongst resident population. Employers could do more to help prepare local communities if they are planning expansion. • Many small voluntary organisations work to mitigate against social tensions. 19
Balancing impacts • Successful economy and tax revenues are needed to support public services, so economy should have primacy. • If we accept the case that economic impacts should be given more weight than social or public service impacts, we are likely to reach the conclusion that economic migration has greater benefits than costs. • Some partners were not in principal against a limit, but as long as it doesn’t impact on viability of businesses. • Getting the limit wrong could impact on economic recovery and this might result in negative social impacts (e.g. crime, social cohesion). PROTECT - MANAGEMENT • Issues to consider: • Should economic, social and public service impacts be given equal weight? If not, what should the relative weightings be? • How should the economic, social and public service impacts be balanced, given the insufficient evidence to consistently quantify and monetise each impact? 20
Alternatives to migration and up-skilling • Timescales: • Takes a long time to train in certain professions (e.g. Doctors). • Up-skilling under way in certain sectors (e.g. Chefs) but time needed. • Acceleration of timescales: • Need to reduce attrition rates for certain occupations. • Need more targeted action to encourage UK workers to enter public sector and shortage jobs. • Need more vocational training. • Barriers: • Limited funding available. • Disincentives for unemployed to up-skill (loss of benefits). • Self-sufficiency hampered by UK emigration (e.g. nurses). • Pay freeze in public sector and general economic climate may make more workers emigrate. • Off-shoring: • If the limit has a negative impact on businesses’ ability to recruit the right people they might move operations abroad. • Alternatively businesses may stay put but have no option but to recruit less skilled people and that might hit productivity. PROTECT - MANAGEMENT 21
Alternatives to migration and up-skilling : issues to consider PROTECT - MANAGEMENT • Given that up-skilling will take time in many occupations/sectors and off-shoring is not always desirable for the UK economy, what does this imply for the trajectory of limits to Tier 1 and Tier 2 in 2011/2012? 22
Forecasting net migration • The extent to which we can forecast EU and British flows is still unresolved, discussed in more detail in the modelling slides. • Large year-on-year volatility in British and EU immigration. • Employers may substitute non-EU for EU under a cap. • The limit should be focused on non-EU migration only, as you can’t control the British or EU components. • To use 2009 as a starting point was not helpful as it was a recession year. PROTECT - MANAGEMENT • Issues to consider: • What should ‘high’, ‘mid’ and ‘low’ scenarios for British and EU migration look like? • To what extent will employers seek to fill jobs from the EEA as an alternative to non-EEA? 23
In-country vs. out-country • Let employers decide whether they prefer to keep existing migrants or bring in new ones. • Employers generally want to keep those immigrant workers they already have, but if they are required to leave they are often happy for this to happen as long as they are replaced. PROTECT - MANAGEMENT • Issues to consider: • Should in-country migrants be included in the limit? If yes: • What mechanism can be used to ensure employers can retain their critical experienced migrant staff? • How do we decide on the limits to be made in-country, given that we cannot predict its impact on net migration? • Which does the Committee value more highly: in-country applicants or out-of-country applicants? What does this imply for the proportion of the limits that should fall on: i) existing migrants?; and ii) new migrants? 24
Dependants • In cost-benefit terms, if dependants are displacing a main migrant, they should account for a reduced proportion of total Tier 1 and 2 migration. • A limit on dependants may discriminate against certain types of people (older migrants or married migrants), who are relatively likely to bring dependants. • Very highly skilled senior people are likely to bring dependants. • Main migrants won’t come if they can’t bring their dependants. • Dependants play an important role in being employed in certain sectors (e.g. social care) PROTECT - MANAGEMENT • Issues to consider: • Should dependants be included in the limit? • Should dependant numbers be reduced by proportionately more than those of main migrants and, if so, how should this be achieved for Tiers 1 and 2? 25
Tier 1 and Tier 2 migrants are economically active and therefore valuable to the UK economy. Tier 1 / Tier 2 vs. other routes PROTECT - MANAGEMENT • Issues to consider: • Should Tiers 1 and 2 be reduced in proportion to other routes? • If not, what should the relative proportions between Tiers 1 and 2 and other routes be? • Should we assume students and family migrants should be reduced disproportionately? 26
Tier 1 • Some people who would previously have come under intra-company transfers, prior to the MAC recommendations on citizenship (intra-company transfers) and bachelors degrees (Tier 1), are now coming under Tier 1. • Many told us a squeeze on T1 would have less of an impact on them than T2. PROTECT - MANAGEMENT Tier 2 • The shortage route improves the UK’s labour market flexibility. • Shortage route migrants may be small in number, but they represent significant numbers for certain sectors. • Combining the shortage and RLMT routes would mean you needed regional shortage lists for local shortages. • A limit on the number of economic migrants means a decision may need to be made on the value of occupations. In future MAC should consider whether shortages in some occupations should be considered a higher priority because of the economic impact they have (e.g. engineers over chefs). • The RLMT allows recruitment into niche jobs that are too specific for the shortage list. • A limit on ICTs might affect the UK’s attractiveness for investment. • Most immigrants on ICTs are temporary and should not be considered as ‘normal’ immigrants. • ICTs are used in different ways (senior people with company expertise and third party contracting) but isolating different uses from each other not straightforward in an operational context. • The CoS allocation mechanism should recognise when companies are sending people abroad, as well as bringing them into the UK. • Tier 2 should feel brunt of limit as it will be easier to up-skill resident workers into T2 jobs. 27
Tier 1 • How much should Tier 1 contribute overall to the reduction? • Tier 2 • How much should Tier 2 contribute overall to the reduction? • Should intra-company transfers be included in the limit? • Within Tier 2, how much should each route contribute to the reduction? • Should the shortage and RLMT routes be combined, as proposed in Government consultation? • Tier 1 vs. Tier 2: • Should the reductions to Tiers 1 and 2 be of equal size? If not, how should we decide the relative proportions of these reductions? Tier 1 and Tier 2: issues to consider PROTECT - MANAGEMENT 28
Distributional impacts • Public vs. private sector • Public sector shortages are caused by low wages, while private sector ones tend not to be. Therefore, the public sector can more easily respond to shortage. The PBS should not favour the public sector. • Public sector employment is contracting and the private sector needs to create 2m jobs. • The public sector suffers from the lack of flexibility that ICTs offer to the private sector. • Issues to consider: • Should the limit be underpinned by policies that favour either the public or the private sector, or specific occupations? If so, how should this be done? • Geographical • The impacts of limits (positive and negative) will not be evenly spread: they will fall disproportionately on the South East. PROTECT - MANAGEMENT 29
Higher fees or auctioning visas could help to limit migration. • Current economic uncertainty makes this a dangerous time to cut immigration. The trajectory should be gradual. • Some companies have had recruitment freezes and now want to hire people. Preventing them from doing so could damage the economy. • Issues to consider: • Should some of the reductions needed to limit net migration be achieved through price or auctioning mechanisms? Other issues in scope PROTECT - MANAGEMENT • A queue will work better than a pool, because there will not be uncertainty while people wait to see if they have been successful. • A pool will work better than a queue, because companies need to be sure they can bring in the very best people, rather than it being subject to a lottery. Out-of-scope issues 30
How to submit evidence? • Responses for MAC consultation on the levels of limits required by 7 September 2010 • Copies available, but also on website at: www.ukba.homeoffice.gsi.gov.uk/mac • Responses to: mac@homeoffice.gsi.gov.uk • UKBA consultation available via: www.ukba.homeoffice.gsi.gov.uk