Download
1 / 60
600 likes | 621 Vues
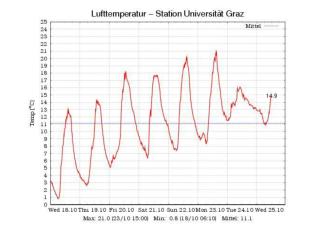
Detailed examination of periodic convective outbreaks in TS Edouard (2002) with data analysis, causes of convective oscillations, and downdraft observations.

E N D
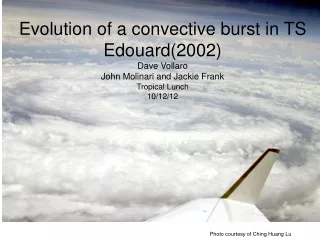
Photo courtesy of Ching Huang Lu Evolution of a convective burst in TS Edouard(2002) Dave Vollaro John Molinari and Jackie Frank Tropical Lunch 10/12/12
Storm Characteristics • Weak tropical storm situated in a high shear environment off the US southeast coast. • Periodic convective outbreaks downshear within the storm core occurred over several days. • Outbreak duration 2-6h followed by long periods without deep convection. • A brief rapid intensification(10 ms-1 over 6h) occurred during one such outbreak as tangential winds locally reached hurricane force before weakening several hours later.
Yellow = 40 flashes (104 km2)-1 h-1 Red = 160 flashes (104 km2)-1 h-1 Cloud-to-ground flash density per unit time, averaged over 25-km radial bins. Contours increase by factors of 2 beginning with 10 flashes (104 km2)-1 h-1.
Questions What was the underlying cause of the convective oscillations in Edouard.
Data • NHC Best Track • ECMWF analyses • 1.125°×1.125°, 13 vertical levels, 6-hourly • 850–200 hPa vertical shear (Corbosiero and Molinari 2002) • Aircraft reconnaissance (HRD) • USAF, NOAA G-IV, 2 P3s (T, Td, wind, D value) • Dropsondes (P, T, RH, wind) • Processed with HRD Editsonde • Satellite data (SSEC, NOAA CLASS) • Lightning data (NLDN) • SST (NASA’s Aqua satellite, 4-km resolution)
Tropical Storm Edouard (2002) Winds Pressure Half barb: 2.5 m s−1 Full barb: 5 m s−1 Flag: 25 m s−1
SSMI Total Precipitable Water(mm) 09/03/02 0223 UTC 1450 UTC
Summary: Large Scale • Trough provided weak positive momentum forcing • Trough enhanced vertical shear • Dry air existed upshear behind trough • SST values fairly uniform under storm.
Hypothesis • Initiation and cessation of the core convection was modulated by downdraft modification of the boundary layer associated with the vertical shear.
Downdraft Observations in Hurricane Bands • Convective downdrafts bring cool, dry air from midlevels to surface and eliminate mixed layer • Midlevel dry air creates mesoscale subsidence via evaporative cooling of precipitation falling from the stratiform anvil. This mesoscale descent can mix in dry air at top of boundary layer. • Sometimes boundary layer air cannot fully recover before being ingested into eyewall, resulting in shallower convection and a weaker storm. Powell 1990
Barnes et al. 1983 • Observational analysis of hurricane Floyd(1981)rainband by multiple P3 flights at several levels. • Noted 12K decrease in θe in boundary layer inside rainband. • Due to convective scale transport via downdrafts of low θe air above boundary layer just outside rainband.
Modeling of Downdrafts in Sheared TCReimer et al. 2010 • Used a 3D nonhydrostatic RAMS model with simplified physics to simulate shear effects on TC intensity. • Intensity change in a sheared TC due to downward flux of low θe air into boundary layer. This low θe air cannot fully recover via fluxes before reaching eyewall thus reducing θe of eye. • Reimer et al. 2010 found VRW perturbations induced by the tilt of inner core of a sheared vortex can reach outward 40-50km, but the perturbations induced by the tilt of the outer vortex can reach outward of 150-200km.
Boundary layer Θe - colors 1.25-2km W(cm s-1) - contoursT=5h * Reimer et al. 2010 Vertical shear sets up stationary wavenumber-1 pattern convective asymmetry outside the eyewall. Downdraft air originating at larger radii downshear spirals inward to upshear outside the eye
L U R D L 15mps case R=75km 7-12h avg W(cm s-1) colors Θe (K) contours Reimer et al. 2010 Outside the eye parcels helically rise ~pseudoadiabatically. An extensive region of downdrafts is found underneath and downwind of these updrafts. Downdrafts most likely result from evaporation of precipitation falling out of the sloping updrafts into unsaturated air. Pool of low thetae air above BL is connected to a midlevel thetae min.
Tang + Emanuel 2012 • Axisymmetric hurricane model with parameterized ventilation • Increasing the strength of the ventilation results in a greater decrease in intensity. Ventilation 2-4km layer. Vary intensity.
Tang + Emanuel 2012 • Axisymmetric hurricane model with parameterized ventilation • Increasing the strength of the ventilation results in a greater decrease in intensity. • Placing the ventilation level in mid-lower levels results in a greater decrease in intensity. Ventilation 2-4km layer. Vary intensity. Ventilation intensity (A50). Vary level.
Tang + Emanuel 2012 • Axisymmetric hurricane model with parameterized ventilation • Increasing the strength of the ventilation results in a greater decrease in intensity. • Placing the ventilation level in mid-lower levels results in a greater decrease in intensity. • As magnitude of ventilation increases storm transitions from a quasi-steady regime to an oscillatory one. The oscillatory regime is characterized by rapid intensity changes over several hours. Ventilation 2-4km layer. Vary intensity. Ventilation intensity (A50). Vary level.
Oscillatory Behavior Tang + Emanuel 2012 • Each oscillation is governed by the life cycle of a convective burst. • Strong mixing deposits high entropy air into the near inner core environment increasing potential slantwise instability. • Elevated convection erupts and precipitation falls out and evaporates inducing downdrafts. • Downdrafts transport low-entropy air into boundary layer. • Induces compensating inflow of low-entropy air at mid levels and the low entropy air in the BL is swept inward by the radial inflow cutting off convection. • Surface fluxes eventually restore the BL entropy and convection can reignite.(~5-8hr) Low-level entropy(shaded) Downdraft Entropy fluxes at 1.5km(white) Max tangential wind speed(m s-1)
0715 UTC 0915 UTC Infrared and Visible satellite images on 3 September 2002.The magenta ring indicates the Best Track center position. The magenta lines indicate USAF reconnaissance flight tracks. 1115 UTC 1315 UTC shear 1515 UTC 1715 UTC
Yellow = 40 flashes (104 km2)-1 h-1 Red = 160 flashes (104 km2)-1 h-1 Cloud-to-ground flash density per unit time, averaged over 25-km radial bins. Contours increase by factors of 2 beginning with 10 flashes (104 km2)-1 h-1. USAF recon flights
USAF reconnaissance aircraft tracks 3 September 2002 shear vector Red: 1120 – 1226 UTC 09/03 Green: 1529 – 1603 UTC 09/03 Blue: 2326 UTC 09/03 – 0011 UTC 09/04 Flight level - 250-500m
Right Left (a) Radial cross-section of lightning density summed over the period from 1100-1259 UTC 3 September(b) SW-NE cross-section of Tangential velocity (m s-1) (c) SW-NE cross-section of θe (K). Red: 1120 – 1226 UTC 09/03 Green: 1529 – 1603 UTC 09/03 Blue: 2326 UTC 09/03 – 0011 UTC 09/04
Azimuthally-averaged Fields θe (K) Tangential Wind (m s-1) D-Value(m) Red: 1121 – 1342 UTC 09/03 Green: 1529 – 1729 UTC 09/03 Blue: 2326 UTC 09/03 – 0034 UTC 09/04
Axisymmetrization of convectively-generated vorticity strengthens storm (Montgomery and Kallenbach 1997) Why was weakening observed? Idealized models do not include vertical shear or downdrafts
Dropsonde and Flightlevel data locations plotted with respect to the storm center on the 1845 UTC 3 September visible satellite image. Dropsondes G-IV Colored squares P-3 Magenta X’s 1851 UTC (inner) 1854UTC (outer) P-3 flight-level data W>|0.5| m s-1 Updrafts = yellow Downdrafts = cyan
Edouard P-3 θe (K) profiles 9/03/02 The 1851 UTC (dashed) lies about 25 km closer to the center than the 1854 UTC sonde (solid).
Floyd(1981) P-3 θe (K) profiles Barnes.et.al 1983 Edouard P-3 θe (K) profiles 9/03/02 The 1851 UTC (dashed) lies about 25 km closer to the center than the 1854 UTC sonde (solid).
Edouard P-3 DCAPE (J kg-1) profiles 9/03/02 The 1851 UTC (solid) lies about 25 km closer to the center than the 1854 UTC sonde (dashed).
Averages from five G-IV sondes released within 110 km of the center between 1803-1816 UTC 9/03 Mean T and Td Mean θe Atkins and Wakimoto(1991) wet microburst index value is 29K which is sufficient to support microburst downdrafts
Summary • Dry air existed behind upper-level trough • Shear-induced circulation brought dry air to low levels. • Strong convective outbreak occurred downshear of the core on Sept. 3rd and produced a local tangential wind of hurricane force. • Resultant downdrafts extinguished convection and modified the boundary layer halting core convection for several hours. • During this period tangential velocity decreased and evolved into a flat profile as storm axisymmetrized. • Convection was suppressed near the core for a time, but the boundary layer eventually recovered and core convection renewed. • Constant shear and dry air prevented long-lived midlevel moistening and the initiation of WISHE
Summary • The repeated outbreaks and cessation of convection in the core occurred as a result of the following sequence: • Low-entropy downdrafts within core convection, • Boundary layer recovery, • Renewed convection and convective downdrafts associated with strong ventilation by vertical wind shear. • This oscillation is consistent with the numerical results of Tang and Emanuel (2012). It is argued, following Powell (1990), Riemer et al. (2010) and Tang and Emanuel (2012), that the intensification and decay of tropical cyclones can be framed as a competition in the boundary layer between surface heat and moisture fluxes (fuel) and evaporatively-driven low-entropy downdrafts (anti-fuel).
Barnes.et.al 1983 Barnes: Observational analysis of hurricane rainband by multiple P3 flights at several levels. Noted 12K decrease in thetae in BL inside rainband. Due to convective scale transport via downdrafts of low thetae air above BL just outside rainband.
Previous Work: Downdrafts and Boundary Layer Recovery • Downdrafts bring cool, dry air from midlevels to surface and eliminate mixed layer • Convective downdrafts bring cool low θe air into boundary layer as gust fronts. • Midlevel dry air creates mesoscale subsidence via evaporative cooling of precipitation falling from the stratiform anvil. This mesoscale descent can mix in dry air at top of boundary layer. • Boundary layer recovery is a function of surface fluxes and downward turbulent fluxing of high θe air from top of the boundary layer. • Sometimes air cannot fully recover before being ingested into eyewall, resulting in shallower convection and weaker storm(Barnes et al. 1983, Powell 1990) Powell 1990
Powell 1990 cont • Convective DD capable of transporting cool low thetae air to sfc eliminating ML. • If near core can weaken storm • Problem – sampling shallow cold pools • Preferred location on inner part of band • Outside of band high thetae air in BL lower thetae air above due to sub drying via evap cooling from anvil • Inner part of band has shallower BL in various stages of recovery • Outward moving band can leave accumulated coldpool in wake as multiple DD add to feature. • Stationary band – Convective DD bring cool low thetae air into BL as gust fronts. Stratiform anvil creates subsidence drying via evap cooling. This mesoscale descent can mix in dry air at top of BL. • BL recovery a function of sfc fluxes and downward turbulent fluxing of high thetae air from top of BL.
Reimer et al. 2010 • Used a 3D nonhydrostatic RAMS model with simplified physics to simulate shear effects on TC intensity. • Intensity change in a sheared TC due to downward flux of low θe air into boundary layer. This low θe air cannot fully recover via fluxes before reaching eyewall reducing θe of eye. • Vertical shear sets up stationary wavenumber-1 pattern convective asymmetry outside the eyewall. Downdraft air originating at larger radii downshear spirals inward to upshear outside the eye. • Outside the eye parcels helically rise ~pseudoadiabatically. An extensive region of downdrafts is found underneath and downwind of these updrafts. Downdrafts most likely result from evaporation of precipitation falling out of the sloping updrafts into unsaturated air. Pool of low thetae air above BL is connected to a midlevel thetae min. • Intensification tends to be tied to DFX. the periods of high downward flux tend to precede periods of weakening or an interruption of intensification. Periods of intensification tend to be associated with small values of DFX. • Reimer .et.al 2010 found VRW perturbations induced by the tilt of inner core of a sheared vortex can reach outward 40-50km, but the perturbations induced by the tilt of the outer vortex can reach outward of 150-200km.
Reimer etal 2010 • Intensity change in a sheared TC due to downward flux of low thetae air into boundary layer. This low thetae air cannot fully recover via fluxes before reaching eyewall reducing thetae of eye. • Argue that vertical shear sets up stationary wavenumber-1 pattern convective asymmetry outside the eyewall With DD air originating at larger radii dshear and spiraling inward to upshear outside the eye.Just above BL is RM DSR and SM USL associated w/vorticity(iecan be broadly explained by ekman punping) • Outside eye parcels helically rise ~pseudoadiabatically. An extensive region of DD is found underneath and downwind of the updrafts. These DD most likely result from evaporation of precip falling out of the sloping updrafts into unsaturated air. Pool of low thetae air about BL is connected to a midlevel thetae min. • In Noshear case bands are not phase-locked and downdrafts are weaker. • Vortex weakens first at the lowest levels in a “bottom up” manner • Intensification tends to be tied to DFX. the periods of high downward flux tend to precede periods of weakening or an interruption of intensification. Periods of intensification tend to be associated with small values of DFX. • Show that the DFX is due to downdrafts associated w/a quasi-stationary convective asymmetry outside the eyewall. • Reasor.etal 2004 and Jones1995 found that vortex in shear tends toward an equilibrium state where the vortex is tilted to left of shear. The outer vortex tilts much more than the core. A vortex in shear strongly projects onto a wavenumber-1 VRW. Vortex dynamics can be described as a forced harmonic oscillator w/damping. The model predicts that the vortex tilt asymptotes into a quasi-equilibrium configuration that is left of shear while the initial vortex tilt decreases. The eventual decrease of the tilt reduces the forcing of the convective asymmetry hindering the formation of a quasi-stationary DD pattern.
Tang+Emanuel 2012 • Reimer .et.al 2010 found VRW perturbations induced by the tilt of inner core of a sheared vortex can reach outward 40-50km, but the perturbations induced by the tilt of the outer vortex can reach outward of 150-200km. • Perturbations induced by the quasi-mode and sheared VRWs are one possible way to advect and mix low-entropy air • Reimer.et.al2010 propose low-level pathway where low-entropy air is carried to the BL via downdrafts where it is swept into the storms core before recovering fully via the secondary circulation. This lower thetae air weakens the storm.
Tang+Emanuel 2012 • As magnitude of ventilation increases storm transitions from a quasi-steady regime to an oscillatory one. The oscillatory regime is characterized by rapid intensity changes over several hours. • Each oscillation is governed by the life cycle of a convective burst. First strong mixing deposits high entropy air into the near inner core environment increasing potential slantwise stability. Then elevated convection erupts and precip falls out and evaporates inducing downdrafts. These DD transport low-entropy air into BL which does 2 things: Induces compensating inflow of low thetae air at mid levels and the low entropy air in the BL is swept inward by the radial inflow cutting off convection. • Surface fluxes eventually restore the BL entropy and convection can reignite.(~5-8hr) • Most effective at middle levels. This is due to low entropy reservoir of drier air situated close to eyewall. The ventilation mixing reduces the entropy front. • At upper levels the effects of ventilation are weak, despite large values of EKE. This is because the entropy gradient is weak so lateral mixing has little thermodynamic effect. • Thermal wind arguments propose that as the radial entropy gradient weakens so will the tangential wind. • Ventilation must be felt across the entire eyewall of transported down to the BL the ability of ventilation to weaken TC is muted. • TE10 states that there is a minimum initial intensity required for strengthening for a given amount of ventilation.
Tang+Emanuel 2012 • Axisymmetrichurricane model w/parameterized ventilation • Increasing the strength of the ventilation results in a greater decrease in intensity • Placing the ventilation level in mid-lower levels results in a greater decrease in intensity. • Upper level ventilation has less impact due to weaker entropy gradient • Entropy gradient greatest at mid-low levels • Reimer .et.al 2010 found VRW perturbations induced by the tilt of inner core of a sheared vortex can reach outward 40-50km, but the perturbations induced by the tilt of the outer vortex can reach outward of 150-200km. • Perturbations induced by the quasi-mode and sheared VRWs are one possible way to advect and mix low-entropy air • FranK+Ritchie(2001) found vshear excites asymmetries through parotropic/baroclinic processes in the upper part of the vortex. These asymmetries descend with time causing a top down weakening. • Cram.et.al 2007 propose that lateral mixing of low entropy air at midlevels can reduce eyewall thetae and weaken the storm. • Reimer.et.al2010 propose low-level pathway where low-entropy air is carried to the BL via downdrafts where it is swept into the storms core before recovering fully via the secondary circulation. This lower thetae air weakens the storm.
CONV DIVG PV DIVG CONV Previous Work: Vertical Shear • Storms typically do not deepen with vertical shear > 12 m s−1 (Gray 1968) • Ventilates core by advecting warmth and moisture downshear and bringing in drier air • Tilts PV column • Creates a convergence/ divergence pattern such that a vertical circulation develops • Vertical circulation helps reduce tilt, also creates convective asymmetry
1553 UTC 3 Sept., 300 m 1150 UTC 2 Sept., 250 m Phase 2 Relative vorticity due to horizontal shear of reconnaissance tangential winds Calculated following Kossin and Eastin (2001)