Download

1 / 60
600 likes | 618 Vues
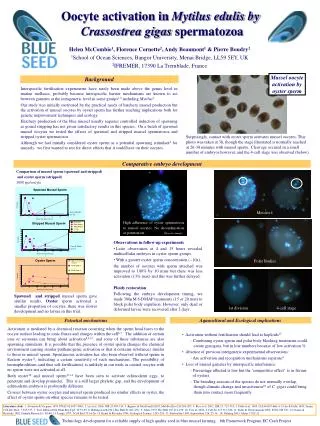
This study examines the diversity of macrofauna in N. Michaniona Bay and the factors influencing the biotope. The team collected samples from different stations in the harbor to analyze the establishment of communities in human-constructed environments. The results can have important implications for coastal area development in the Mediterranean.

E N D
MAIN CHARACTERISTICSOF THE BIODIVERSITY OF THE MACROFAUNAIN N. MICHANIONA BAYOF THERMAIKOS GULF • MID-LITTORAL DISTRIBUTION OF MYTILUSGALLOPROVINCIALISINTHESSALONIKI BAY. • The team • Jens Henrik Ringsbo • Mattias von Schantz • Harald Kellner • Birgit Nehrwein • Eva Mourgi • Fotis Sgouridis • George Anasontzis
Introduction The main aim of the present study is to determine the diversity of the macro fauna in the N. Michaniona Bay and the factors that affect the biotope. In order to examine how a community can be established in an environment constructed by man and how biological and physical factors interact to define the identity of the community, several samples from different stations of the harbour have been taken. The subject is interesting while the result can be of great importance when decisions are taken to change coastal areas in the eastern Mediterranean into harbours. This is a current subject when more and more of the coasts are changed to correspond to the will of tourists and industries.
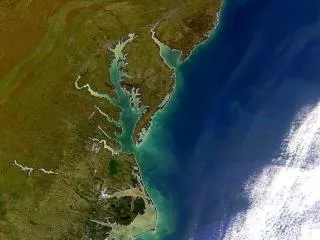
Materials and methods The sample area is located on the eastern coast of Thermaikos gulf (Nea Michaniona) in the north Aegean Sea. The area was chosen because of the existence of artificial hard substrate and due to the fact that the area is not directly affected by the outlets of the nearest urban region (Thessaloniki 30 km). The harbour is exposed to southern and south-western winds that are present mostly during summertime. The sources of organic pollution are mainly alluvial deposits from the estuarine system of the rivers situated on the north-western part of Thermaikos Gulf. Those deposits are carried by the surface currents to the coasts of N. Michaniona (Anagnostou et al. 1997, Krestenitis et al. 1997).
The sampling took place on the hard artificial substrate of the docks of the fishing harbour of N. Michaniona. The area is well known for its large fishing fleet and also for different kinds of trawlers that anchor the port. The number of fishing boats using the port is the largest in Greece and has increased during the last years due to the construction of a new dock. All the above induced the change of the physiognomy of the area, as well as the increase of organic loads from intensive fishing activities (Baxevanis,1999). Sampling was carried out in four different stations, two of which were located on the exposed branch of the dock (A and B) while the other two in the inner, less exposed part, across the new harbour (C and D). The distance between A and B stations was about 60m. D was near the mouth of the new dock, next to anchored trawlers, whereas C was at the sheltered corner, as it is shown in figure :
Community structures • A and B (outer port) are almost homogenous • Differences between inner and outer port • Differences within C and D (inner port). Sample C was taken in a corner. Jens Henrik Ringsbo
Samples were taken by free divers, equipped with a • quadrate of 0.25 m2 and knives. • During the first two sampling periods (A and B • stations), 9 replicates were taken. • The species in every replicate were sorted out separately and identified. • After the identification the species were stored separately in formaline in order to be preserved
Abiotic Factors The data shows that the sample sites are almost similar concerning the abiotic factors. As sample sites C and D were inside the harbor there is a difference in current and wave action in comparison to the other sample sites, which are outside the harbor.
The number of individuals within every species was counted and put in a table. From this table the minimum area could be calculated (See below). diagram 1
According to diagram 1 we observed that the blue curve, station A, has a plateau at sample 4. This plateau is probably due to bad sampling and can’t be considered as representative result. Furthermore, the same curve tends to make a second plateau after the 7th replicate. The pink curve, station B, also shows a plateau, but after the 6th sample. The most probable explanation is that we met a new community during our sampling and new species entered the measurements causing the sudden shift in both curves. The second plateau at station A seems to be at the same level With the plateau at station B. The decision was taken to collect 6 replicates from the sampling stations C and D. The species from stations C and D were sorted out and identified. All the results are summarized in the following table.
Diversity indices • Three different indices were calculated: • Shannon-Weaver index, one of the most commonly used species diversity indices. The diversity index consists a mathematical expression of the degree of participation of the individuals of different species in a specific sampling area in a community. • Evenness index represents the relationship between the • Shannon-Weaver value and the maximum mathematical evenness possible. It expresses the stability of the communities. It measures the distribution of individuals among species. • 3. Richness index is the total number of species..
Calculations of Shannon-Weaver, Evenness index and Richness index 1. Shannon-Weaver: H’= -Σpi·log2 pi where pi = ni/N Σ = sum ni = number of individuals of i1,i2, etc N = total number of individuals 2. Evenness index: J’= H’/ log2 s where J’= Evenness H’= Shannon-Weaver index s = total number of species 3. Richness index: The total number of species.
DISCUSSION • Concerning the measurements of pH and salinity, presented on the table, there are no differences in the values. The temperature differences can probably be attributed to the different weather conditions. The first day was sunny, while the second was cloudy and it was raining. • The only physical parameter that can differentiate the four stations was currents. The Stations A and B were exposed, while the stations C and D were sheltered.
On the whole, 176 individuals were counted and classified into • taxonomic groups.As it is shown in the tables, it must be • pointed out that: • The community observed in A and B is typical for the rocky intertidal zone with Xantho poressa as leading species • The dominant algae in A and B is Ulva sp., which is an indicator of pollution, and therefore was expected to be found also in C and D. However, it was almost entirely absent and probably this can be explained by the fact that herbivores (like gastropods) were abundant and have grazed Ulva. • Some crustaceans are sensitive to pollution. Considering the stations it is obvious that the number of Crustaceans • increases when we go further from the main source of pollution • (31 Xantho sp. in A and B, 5 in C and D). • In station D Polychaeta is the dominant phylum. They can be considered as indicators of the pollution in the region.
Diversity indices In station D diversity (Shannon-Index,H’) and evenness (J’) have the lowest values, which means that in D community there is a small number of dominant species and the community is not stable. The indices are lower in stations A and B comparing to C, where there is a more homogeneous species composition (highest J’). The high values for C can be explained by the fact that the site is placed in a sheltered corner , which offers a more stable habitat that provides the ability to survival to many species.
Feeding behaviour Regarding to our results about feeding habits we observe high percentage of grazers in station C and D that probably feed on the abundant encrusting algae. The same area is also inhabited by a lot of suspension feeders, that benefit of the high amount of nutrients in the water. In D where more watershed circulation is observed the number of suspension feeders is higher. Many sponges are observed in C and D, but not in A and B, because their larvae need calm waters to settle. The high amount of carnivores in sample sites A and B can either be explained by seasonality or the fact that the smaller rocks there provide a more suitable habitat and feeding area.
Conclusion The different results of the 4 stations can be attributed to the different locations of the samplings. Stations A and B were outside the main harbor, that is why we found similar species. The factor that probably influenced that regions was the currents. Stations C and D were situated inside the harbor, affected by high nutrient level due to calm water and wastes from the fishing boats, and that’s why we found that special species composition. Particularly, station C was at the corner of the harbor, where there was no circulation of the water and the conditions were stable. Station D was the nearest station to the main port. However, the sample sites at Nea Michaniona were only visited one time, so that many of the phenomena observed could be due to seasonality. In addition, sampling took place only once!
MID-LITTORAL DISTRIBUTION OF MYTILUSGALLOPROVINCIALIS IN THESSALONIKI BAY. • The team • Jens Henrik Ringsbo • Mattias von Schantz • Harald Kellner • Birgit Nehrwein • Eva Mourgi • Fotis Sgouridis • George Anasontzis
Introduction The aim of this study is to see how Mytilus galloprovincialis is distributed in Thessaloniki bay, and how it is affected by exposure of outlets. Referred to other studies, benthic algae (Fuge et al., 1974; Seeliger et al., 1977), copepods (Zafiropoulos, 1977), tunicates (Papadopoulo, 1977), fishes (Dix, 1975, Greig, 1977) and molluscs (Boyden, 1975; Watling, 1976 b; Pesh, 1977) have all proved suitable for revealing heavy metal pollution. Goldberg (1975) suggests that the Mytilus in particular could be used for a preliminary examination, extended to all seas, of such pollutants as heavy metals, hydrocarbons, DDT, PCBs, and transuranic elements. (Majori, 1998)
The mussels are considered as one of the most important biological indicators in order to study pollution in marine environment, caused by toxic substances. This is due to the fact that they are organisms that are mostly sedentary and have the ability by filtering huge amounts of sea water to bioaccumulate toxins that are found only in traces in the marine environment (NAS, 1980, Cossa D.,1989). Furthermore Mytilus galloprovincialis communities are found in great abundance in Thermaikos Gulf, either in wild populations or in aquacultures and they are of great commercial importance ( F. Bei, V.A Catsiki & E. Galenou, 1997). In Greece, the largest cultivated populations of the species are found in Thermaikos Gulf (Macedonia, Northern Greece) (Jones et al. 1994). Despite their great economic significance, our knowledge of the ecology of M. galloprovincialis, regarding populationabundance (both in time and space), in the N.Aegean Sea is quite restricted and is based mainly on Kocatas(1978), Topaloglou & Kihara(1993), Jones et al. (1994), Pagou & Chintiroglou (1995) and Le Breton & Chintiroglou (1998).
While it was not possible, due to lack of technical equipment, to do analysis of heavy metals accumulated in Mytilus galloprovincialis, we relied on the structure and composition of its communities in the collected samples. This was done in accordance to see how the samples resembled to or differed from each other and how those results could be explained taking under consideration biological and physical factors. Moreover, we referred our collected data for the area and compared those with those of other studies.
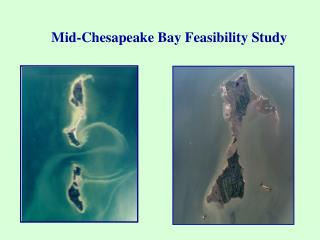
Material and Methods Samples were collected at four different stations along the coast of Thermaikos gulf and mainly in the bay of Thessaloniki. The first sampling site was in the area of Calochori (station A). This area can be considered to be rather polluted mainly because of its neighboring industrial area of Thessaloniki and the nutrient- rich water coming with the estuarine system of the rivers Axios, Loudias and Aliakmonas. The chosen sampling site was in a sheltered corner with shallow and calm water. Three samples of the same volume were taken with the aid of a cylinder called Corer ( 20cm diameter) from mid- littoral communities attached on an artificial hard bottom.
The second sampling site (station B) was in the city of Thessaloniki on a dock belonging to a yacht club. This site is certainly influenced by urban waste and runoff from the city. Three samples were taken in the same way from the mid- littoral zone. The two last locations, Perea and Agia Triada, (stations C and D) were selected because they were the only artificial substrates with a substancial M.galloprovincialis population established on them, and also because they were the least polluted in the bay area (Koukouras 1979). They were located near to a public beach and the water was relatively clear and shallow. The same method was used and three equal samples were collected from C. However, sampling in station D was different. Only one big sample was collected but also two smaller ones (using another cylinder10 cm diameter). This station was not meant to be studied but it was added because of some difficulties in the sorting that are described below.
The samples were then stored in plastic bags containing formalin in order to be sorted, identified, counted and measured in length and weight in the laboratory. The sorting and counting of the mussels (Mytilus galloprovincialis) was causing some problem, while they contained a lot of juveniles, which were small and numerous. After some discussion within the group the decision was taken to measure a sub sample of the big sample depending on the number of mussels. To be able to know if this method could be acceptable the station D was added to the study, as mentioned above. The mean length of the mussels in the two small samples was calculated and we found out that it was almost the same with the mean length in the 1/16 of the big sub sample. In this way we verified our method and the procedure continued.
DETERMINATION OF i • WHAT MEANS i ? • i is the class width, which is needed for the frequency in the following histograms! • Determination: i = standard deviation / 4 • Determined standard deviation: 6,1 • Resulting Class width: 1,5 mm
3 distinct age classes, probably March 2000, January 2000 and Autumn 1999. No adults were observed.
The length of the mussels was measured in order to calculate the standard deviation and average length to make it possible to put them into length classes. This is important while the weight could be more easily measured with a smaller representative amount of mussels. The weight was measured from station A and C. The reason why not all four samples were measured was completely because of lack of time. However, those two stations can be considered as representative because A is a polluted area and C a rather clean one. Three age classes could be observed. Five mussels were taken from the youngest class (settled in March 2000) and five from the oldest class (settled last year). The second class (January 2000) was not measured, because it was not present in the C-sample. Thus, no comparison between the second class of the two stations was possible. All other species found in the cluster of mussels were also identified and used to measure Shannon-Weaver, Evenness index and Richness index.
Mytilus IN GENERAL Pic.1: Mytilus sp. (www.aldebaran.org /impressionen/miesmuschel.htm) • Size: normally between 5 and 8 cm, max. 15 cm • Live in colonies and are attached with strong byssus threads • Important cleaner of the costal water, one individual can filter ca. 3 l/h • Feed Plankton • Found in southern and northern hemisphere • Rapid growth in Mediterranean Sea (up to 50 mm / in the 1. Year) • Commercial production (Greece ca. 30000 t/year) • Important indicator species
COMPARISON BETWEEN 20CM CYLINDER (D) AND 10CM CYLINDER (Dsub)
COMPARISON OF THE SITES IN NUMBER AND LENGTH The density in site A is lower than in other sites. Site B, C, and D have a lot of juveniles of the first age class compared with A, visible on the smaller average of length.
3 distinct age classes, probably March 2000, January 2000 and Autumn 1999. No adults were observed.
RESULTS OF THE DEMOGRAPHIC HISTOGRAMS Adults were only observed in sample site D. B, C and D were characterized by high percentages of juvenile mussel of the first age class. Site A shows distinct age classes compared to the others.
HYPOTHESIS Pic.3: Mytilus sp. (www.biology.ucsc.edu/classes/bio161l/Images/Animals/a30myt.html) Referred to our results, we expect that the main reproduction probably takes place outside the Thessaloniki Bay. The main recruitment of the different sample sites is strongly affected by the current (counter-clockwise) within the Thessaloniki Bay.
Pic.2 NASA Main current in the Thessaloniki Bay causes differences in the larvae distribution (space and time).
WEIGHT Measure of the weight of different size classes (juvenile, 30 mm class). Pic.4: Mytilus sp. (web.mit.edu/corrina/tpool/cmussel.html) RESULT Mytilus at site A have more shell weight than on site C. The fresh body weight is almost the same on both sites.