Download
1 / 29
290 likes | 390 Vues
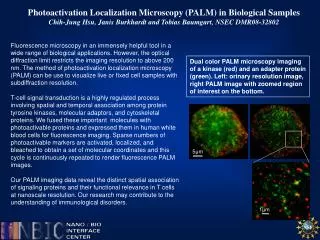
AO Microscopy of Biological Systems. Slides thanks to Prof. Joel Kubby, EE at UCSC. Wide-Field AO Correction of Green Fluorescent Sample Beads. Drosophila Embryo. AO Off. AO On. Oscar Azucena, UCSC. AO in Astronomy and Biology. AO reveals a binary star. AO reveals distinct structures.

E N D
AO Microscopy of Biological Systems • Slides thanks to Prof. Joel Kubby, EE at UCSC
Wide-Field AO Correction of Green Fluorescent Sample Beads Drosophila Embryo AO Off AO On Oscar Azucena, UCSC
AO in Astronomy and Biology AO reveals a binary star AO reveals distinct structures
Wavefront Aberrations in Microscopy na=1.000 nw=1.331
Wavefront Aberrations in Microscopy Wavefront aberrations due to a change in a sample’s refractive index δn
Fluorescent Protein Guide-Stars GFP-labeled centrosomes for biological guide-stars in adaptive optic microscopy Prof. Roy, McGill University
Guide-star Proteins can be Located in the Mitotic Apparatus Kinetochore Centrosome Chromosome
Wavefront Measurements Oscar Azucena, UCSC
Wavefront Aberrations Measured in Drosophila Embryo Oscar Azucena, UCSC
Confocal Images of GFP Labeled Tubulin in Drosophila Embryos Surface 30 μm below the surface Prof. William Sullivan, UCSC MCD Biology
AO Wide-Field Microscope Oscar Azucena, UCSC
Injection of Fluorescent BeadReference Beacons in Drosophila Embryo 1 μm crimson beads Oscar Azucena, UCSC
Wide-Field AO Correction of Crimson Reference Beacon Correction of 1 μm microsphere 100 μm beneath surface embryo 40% correction The length of the bar is equal to the diffraction limit of the 40X (0.75 NA) objective lens, 0.45 µm. Uncorrected image of a bead 10X improvement in relative Strehl ratio Oscar Azucena, UCSC
Wide-Field AO Correction of 1 μm Green Sample Beads Drosophila Embryo AO Off AO On Oscar Azucena, UCSC
AO Confocal Microscope Xiaodong Tao, UCSC
AO 2P Microscope Ti:Sapphire Laser 700nm – 1100nm Tunable Helium Neon Laser (633nm) L6 Deformable Mirror Wavefront sensor DB1 DB2 DB3 F1 L7 L4 L5 L2 Y Scanner X Scanner L1 F2 PMT Tube Lens Xiaodong Tao, UCSC
Wavefront measurements from a 1 μm fluorescent microsphere through 100 μm thick brain tissue Xiaodong Tao, UCSC
Confocal Images of Mouse Brain Tissue AO Off AO On 15 μm 50 μm 100 μm Xiaodong Tao, UCSC
Fluorescent Protein Guide-Stars (YFP) Dendrite Cell Body Xiaodong Tao, UCSC
Drosophila Embryo Before correction After correction Depth: 83 μm Cannot see the centrosomes Can see the centrosomes The images and PSF without (a) and with (b) correction for a cycle 14 fruit fly embryo with GFP-polo at the depth of 83 μm. Scale bars, 2 µm Xiaodong Tao, UCSC
Improvement in Deep Tissue Imaging Xiaodong Tao, UCSC
Conclusions • Fluorescent proteins can be used as reference beacons for wavefront measurements in adaptive optics • Improve relative Strehl ratio in 20 μm thick Drosophila embryo by up to 10x • Improve relative Strehl ratio in 100 μm thick mouse brain tissue imaged by AO confocal microscope by up to 4.7x • Currently imaging GFP (Drosophila) and YFP (mouse brain tissue) labeled samples • Extending Measurements to Live Imaging
Too slow for live imaging Photo-toxicity and photo-bleaching of sample Information can be lost Problems with Indirect Approachesto AO in Biological Imaging
Phase Stepping Interferometry M. Schwertner, M. J. Booth, M. A. A. Neil, T. Wilson, Measurement of specimen-induced aberrations of biological samples using phase stepping interferometry, Journal of Microscopy Volume 213, Issue 1, pp. 11–19 (2004)
Aberrations in Biological Specimens Martin J. Booth, Michael Schwertner and Tony Wilson Mouse brain Mouse ooctye Mouse liver Mouse smooth muscle Mouse heart muscle c. elegans
Aberrations in Brain Tissue 1.0 1.0 0.8 0.8 0.6 0.6 0.4 0.4 0.2 0.2 0.0 0.0 -0.2 -0.2 -0.4 -0.4 -0.6 -0.6 -0.8 -0.8 -1.0 -1.0 Thickness = 50 μm Thickness = 200 μm m m Peak-Valley: 2 μm Xiaodong Tao, UCSC
Aberrations in Brain Tissue 0.05 0.05 0.05 0.05 0.05 0.05 0.00 0.00 0.00 0.00 0.00 0.00 -0.05 -0.05 -0.05 -0.05 -0.05 -0.05 -0.10 -0.10 -0.10 -0.10 -0.10 -0.10 -0.15 -0.15 -0.15 -0.15 -0.15 -0.15 -0.20 -0.20 -0.20 -0.20 -0.20 -0.20 -0.25 -0.25 -0.25 -0.25 -0.25 -0.25 μm μm μm μm μm μm # 4 6 8 10 12 14 16 18 20 22 24 4 6 8 10 12 14 16 18 20 22 24 4 6 8 10 12 14 16 18 20 22 24 Thickness = 30 μm Thickness = 50μm Thickness = 80 μm Spherical aberration increases with depth # 4 6 8 10 12 14 16 18 20 22 24 4 6 8 10 12 14 16 18 20 22 24 4 6 8 10 12 14 16 18 20 22 24 Thickness = 200 μm Thickness = 150 μm Thickness = 100 μm Xiaodong Tao, UCSC