
Cellular Response to Rapamycin Treatment: Insights from Figures and Cell Viability Data
Study presents relative levels of key proteins, cell numbers, viability, and tumor volume data after Rapamycin treatment in various cell lines. Results provide valuable insights into cellular responses to treatment.

Cellular Response to Rapamycin Treatment: Insights from Figures and Cell Viability Data
E N D
Presentation Transcript
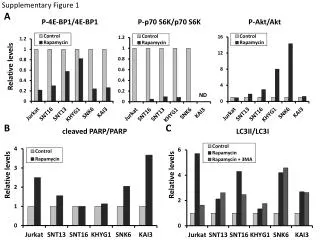
Supplementary Figure 1 A P-4E-BP1/4E-BP1 P-p70 S6K/p70 S6K P-Akt/Akt Relative levels ND B C cleaved PARP/PARP LC3II/LC3I Relative levels Relative levels
Supplementary Figure 2 Jurkat SNT13 KHYG1 KAI3 A * * * * * Cell number (x105) * * * * * * * hours hours hours hours B C * * * * * * * * * Viability (% of control) * * MTS reduction (% of control) * Days Rapamycin (nM)
Supplementary Figure 3 B SNT16 - + SNK6 - + A CCI-779 P-4E-BP1 P-p70S6K p27 CDK2 Rb β-Actin C * * * * %of total %of total * * * *
Supplementary Figure 4 * * * * * * Tumor volume (mm3) * CCI-779 * * * * * * Days