Download
1 / 1
10 likes | 166 Vues
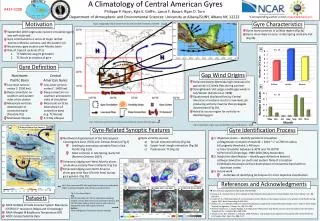
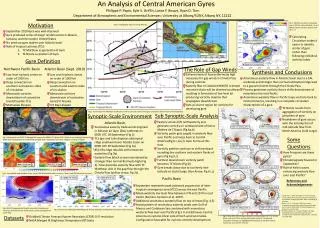
Philippe P. Papin, Kyle S. Griffin, Lance F. Bosart , Ryan D. Torn. Department of Atmospheric and Environmental Sciences: University at Albany/SUNY, Albany NY, 12222. Motivation.

E N D
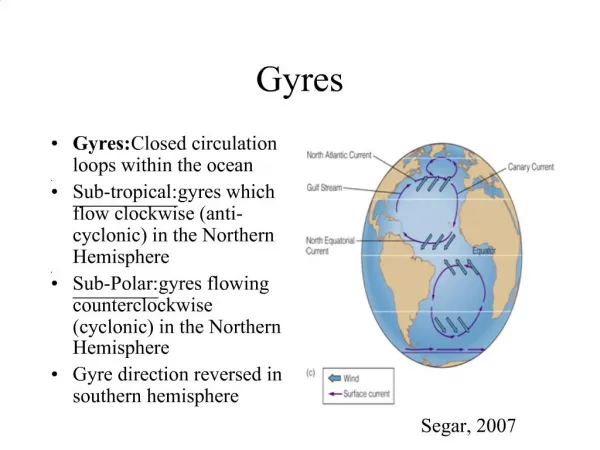
Philippe P. Papin, Kyle S. Griffin, Lance F. Bosart, Ryan D. Torn Department of Atmospheric and Environmental Sciences: University at Albany/SUNY, Albany NY, 12222 Motivation Fig 7. 850 hPa Circulation calculated over a 500 km radius (shaded, s-1) and 850 hPa winds (vectors, between 10-20 m s-1) Fig 1b. Topography map of Central America. • September 2010 Gyre was well observed • Gyre produced series of major rainfall events in Mexico, Jamaica, and the eastern United States • No previous gyre studies over Atlantic basin • Role of tropical cyclones (TCs) • TC Matthew as generator of Gyre • TC Nicole as product of Gyre Calculating Circulation makes it easier to identify center of gyre rather than following individual vorticity lobes A 0000 UTC 27 Sep 2010 0000 UTC 25 Sep 2010 1200 UTC 24 Sep 2010 L Gyre Definition B 0000 UTC 29 Sep 2010 1200 UTC 25 Sep 2010 0000 UTC 26 Sep 2010 The Role of Gap Winds Northwest Pacific Basin Atlantic Basin (Sept. 2010) Synthesis and Conclusions An Analysis of Central American Gyres Enhancement of Azores-Bermuda high necessary for gap winds in Chivela Pass during summer. Easterly flow on idealized NW/SE oriented mountain chain will be diverted southward, resulting in formation of low level jet producing vorticity maxima that propagates downstream. Acts as source region for vorticity for developing gyre Low level cyclonic vortex on order of 2500 km Deep convection on southern and eastern sides of circulation Mesoscalevorticies downstream of convective band (Possible TCs) Multiweek lifespan Low Level cyclonic vortex on order of 1000 km Deep convection on southern and eastern sides of circulation Mesoscalevorticies downstream of convective band (TC Nicole) 3-5 Day Lifespan Anomalous easterly flow in Atlantic basin due to a SAL outbreak and stronger than normal subtropical ridge lead to a gap wind event through the Chivela Pass Process generates vorticity that is shifts downstream of mountains into east Pacific Anomalous westerly flow in Pacific loops vorticity back to Central America, resulting in a complete circulation characteristic of a gyre. 1200 UTC 26 Sep 2010 0000 UTC 27 Sep 2010 1200 UTC 27 Sep 2010 0000 UTC 28 Sep 2010 TC Nicole results from aggregation of vorticity on periphery of gyre. Breakdown of gyre occurs with the introduction of mid-latitude flow from North America (cold surge) B A SAL Fig 1. Track map of TCs Matthew and Nicole as well as a broad outline of the gyre circulation domain from 24-30 September. Sub Synoptic-Scale Analysis Synoptic-Scale Environment Easterly winds shift northeasterly and generate vorticity on windward side of Sierra Madrea de Chiapas (Fig 6a,b) Vorticity patch gets caught in westerly flow over Pacific and loops back to Central America(Fig 6 c,d,e,f). Gyre Forms at this time Vorticity patches continue to shift eastward rounding the southern and eastern flanks of gyre (Fig 6 g,h,i) Furthest downstream vorticity patch becomes TC Nicole (Fig 6j) Gyre breaks down due to northerly mid-latitude air (Cold Surge, Blue Arrow, Fig 6 i,j) Atlantic Basin TC Matthew TC Matthew Anomalous easterly trade winds originate in Saharan air layer (SAL) outbreak on 0000 UTC 18 September (Fig 2) TCs Igor and Julia displace subtropical ridge southward over Atlantic basin on 0000 UTC 20 September (Fig 3a) 850 hPa ridge rebuilds with enhanced easterlies (Fig 3b) Easterly flow (black arrow) maintained by stronger than normal Bermuda high (Fig 4). Flow precedes easterly flow with TC Matthew; aids in the gap flow through the Chivela Pass (yellow arrow, Fig 3c). 1200 UTC 28 Sep 2010 0000 UTC 29 Sep 2010 C D Fig 2. Meteosat 9 and GOES 12 Merged SAL Imagery For 0000 UTC 18 Sep 2010. Yellow to red shading indicates dry, dusty lower tropospheric air, while white and gray areas represent cloud cover. Imagery courtesy of CIMSS Some Questions TD Matthew TC Matthew TC Julia E F TC Igor How Frequent are these gyres? Climatologically favored in September? Role of Kelvin waves enhancing westerly flow over east Pacific? TC Matthew TC Matthew 0000 UTC 24 Sep 0000 UTC 20 Sep 0600 UTC 25 Sep G H Fig 3. Precipitable water(shaded, every 2 mm), 850 hPa heights (white contours, 3dam), and 850 hPa winds (vectors). Pacific Basin A 0600 UTC 25 Sep B 0000 UTC 27 Sep References and Acknowledgements Anomalous Ridge September represents peak poleward progression of inter-tropical convergence zone (ITCZ) across the east Pacific. Mean westerly low level flow between 5oN and 15oN in east Pacific (Romero-Centeno et al. 2007). Additional anomalous westerly flow on top of mean (Fig. 4,5) Broad pattern of anomalous easterly winds over Gulf of Mexico and Caribbean Sea combined with anomalous westerly flow over east Pacific (Fig 5 A and B) leaves Central America on cyclonic shear side of both wind anomalies. Configuration favorable for cyclonic vorticity development. I J • Lander, M. A., 1994: Description of a monsoon gyre and its effects on the tropical cyclones in the western north Pacific during August 1991. Wea. Forecasting, 9, 640–654. • Mozer, J. B., J. A. Zehnder, 1996: Lee vorticity Production by Large-Scale Tropical Mountain Ranges. Part I: Eastern North Pacific Tropical Cyclogenesis. J. Atmos. Sci., 53, 521–538. • Romero-Centeno, R., J. Zavala-Hidalgo, G. B. Raga, 2007: Midsummer Gap Winds and Low-Level Circulation over the Eastern Tropical Pacific. J. Climate, 20, 3768–3784. TC Matthew TS Nicole Fig 4. 850 hPa geopotential height anomalies (shaded every 5m) along with anomalous winds (vectors) both averaged from 23-25 Sept. Fig 5. Panel plots displaying NASA Merged IR BT data (shaded), and 850 hPa anomalous winds (vectors). Datasets Gridded Climate Forecast System Reanalysis (CFSR) 0.5o resolution NASA Merged IR Brightness Temperature (BT) data Fig 6. Panel 850-700 hPa layer relative vorticity (shaded, 10-5 s-1), terrain (black contours, 500 m and up) and winds (vectors). The general circulation of the gyre is highlighted by the black arrow and vorticity maximums are circled in maroon.