Download
1 / 2
20 likes | 110 Vues
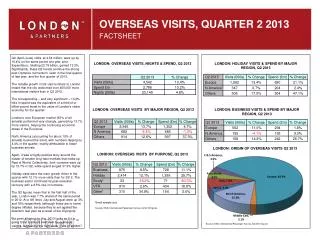
Overseas visits to London in Q2 2013 saw significant growth, with a 10.4% increase in visits and a 13.2% rise in expenditure compared to the previous year. The European market performed strongly, while North America saw a slight decline. Holiday visits drove growth, positioning London for a record year in overseas tourism.

E N D
OVERSEAS VISITS, QUARTER 2 2013 FACTSHEET • Q2 (April–June) visits, at 4.54 million, were up by 10.4% on the same period one year prior. Expenditure, totalling £2.78 billion, gained 13.2%. Significantly, these Q2 trends continue the strong post-Olympics momentum seen in the final quarter of last year, and the first quarter of 2013. • The notable growth in Q2 visit numbers to London meant that the city welcomed over 400,000 more international visitors than in Q2 2012. • The corresponding – and very significant – 13.2% hike in spend was the equivalent of a third-of-a-billion pound boost to the value of London’s visitor economy for the quarter. • London’s core European market (65% of all arrivals) performed very strongly, generating 13.7% more visitors, belying the continuing economic stress in the Eurozone. • North America (accounting for about 15% of arrivals) bucked the trend, with numbers dipping by 4.4% in the quarter, mainly attributable to fewer business arrivals. • Again, it was a highly positive story around the cluster of smaller long-haul markets that make up Rest of World. Collectively, their numbers were up by 12.7% in Q2, while spend surged 37.3% higher. • Holiday visits were the main growth driver in the quarter with 12.1% more visits than for 2012. The business sector continued its post-recession recovery with a 8.5% rise in numbers. • The Q2 figures mean that in the first half of the year, London was7.7% ahead of the same period in 2012. At a UK level, July and August were up 3% and 16% respectively (although these are to some degree inflated, because they’re set against the downturn last year as a result of the Olympics). • But even allowing for this, 2013 looks as if it is going to be London’s best ever for overseas visitors, surpassing the high-water mark of 2006/07. LONDON: HOLIDAY VISITS & SPEND BY MAJOR REGION, Q2 2013 LONDON: OVERSEAS VISITS, NIGHTS & SPEND, Q22013 LONDON: OVERSEAS VISITS BY MAJOR REGION, Q2 2013 LONDON: BUSINESS VISITS & SPEND BY MAJOR REGION, Q2 2013 LONDON: ORIGIN OF OVERSEAS VISITS Q2 2013 LONDON: OVERSEAS VISITS BY PURPOSE, Q2 2013 *Small sample size Source: ONS, International Passenger Survey, Q2 2013figures Source: ONS, International Passenger Survey, Q2 2013 figures
OVERSEAS VISITS, QUARTER 2 2013 FACTSHEET LONDON: LEADING OVERSEAS MARKETS BY VISITS, Q2 2013 LONDON: LEADING OVERSEAS MARKETS BY SPEND, Q2 2013 * Small sample, less than 100, * Small sample, less than 100 Source: ONS, International Passenger Survey, Q2 2013 figures Source: ONS, International Passenger Survey, Q2 2013 figures