Download
1 / 11
110 likes | 230 Vues
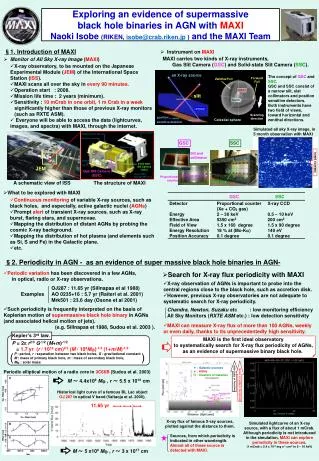
MAXI observation of Blazars. Naoki Isobe , Yoshihiro Ueda (Kyoto University) Kousuke Sugimori , Nobuyuki Kawai (Tokyo Tech.) Hitishi Negoro (Nihon Univ.) Mutsumi Sugizaki , Masaru Matsuoka (RIKEN) On behalf of the MAXI team. Isobe et al. 2010 PASJ letter (arXive:1010.1003). Blazars.

E N D
MAXI observation of Blazars Naoki Isobe, Yoshihiro Ueda (Kyoto University) KousukeSugimori, Nobuyuki Kawai (Tokyo Tech.) HitishiNegoro (Nihon Univ.) MutsumiSugizaki, Masaru Matsuoka (RIKEN) On behalf of the MAXI team Isobe et al. 2010 PASJ letter (arXive:1010.1003)
Blazars Jet • A class of AGNs with a relativistic jet pointing to our line of sight. • Non-thermal radiation from radio to g-ray frequencies • Synchrotron • Inverse Compton • Rapid and high-amplitude intensity variation • As a probe of jet dynamics, particle acceleration associated with jet • MAXI has a great potential for long-term monitor of blazars MAXI FSRQs LBLs HBLs FSRQ : Flat Spectrum Radio Quasars LBL : Low-freq. peaked BL Lac objects HBL : High-freq. peaked BL Lac objects (e.g., Fosatti et al. 1998)
MAXI lightcurveof Mrk 421 • A nearby HBL at a redshift of z = 0.031 • First and brightest extragalactic Very High Energy g-ray source • Synchrotron peak is located at the X-ray band • Extensively studied in X-ray band • Ginga (Makino et al. 1992) • ASCA (e.g., Takahashi et al. 1996) • Suzaku (Ushio et al. 2009) • etc, • X-ray flares frequently reported with Swift or RXTE (e.g., Tramacere et al. 2009) Flare@2010 Jan. 01 (ATEL 2368) Flare@2010 Feb. 16 (ATEL 2444) F2-4 keV 100 mCrab F4-10 keV 100 mCrab 55100 55200 55400 55500 2009 Sep. 01 2009 Dec. 01 2010 Mar. 01 2010 Jun. 01 2010 Sep. 01
MWL lightcurveof Mrk 421 2010 Jan. 01 ATEL2368 2010 Feb. 16 ATEL2444 Radio telescope @Yamaguchi Univ. 8.4 GHz Kamimura et al. Sasada et al. Kanata telescope Optical SSC 0.7 – 1.7 keV 100 mCrab GSC 2 – 4 keV GSC 4 – 10 keV Swift/BAT 15-50 keV (http://heasarc.gsfc.nasa.gov/docs/swift/results/transients/BAT_detected.html) 2009 Nov. 10(ATEL2292) Fermi 0.1 – 300 GeV (http://fermi.gsfc.nasa.gov/ssc/data/policy/LAT_Monitored_Sources.html) 55100 55200 55400 55500
Strong flares from Mrk 421detected with MAXI 2010 January 2010 February MAXI GSC 2-10 keV 6 hour average Swift/BAT 15-50 keV daily HR1 F4-10 / F2-4 HR2 F15-50 / F2-4 VHE g-ray flare with VERITAS (ATEL 2443, Ong et al.) 120±10 mCrab (MJD = 55197.4) 164±17 mCrab (MJD = 55243.6) (c.f., 130 mCrab at 2008 June; Donnarumma et al. 2009 )
X-ray spectrum of Mrk 421 during the strong flares MAXI spectra at the flare peaks G =2.0 G =2.5 3 day average G=3 HR2 = F15-50 / F2-4 Preliminary G=2 HR1 = F4-10 / F2-4 2 Energy [keV] 10 • Photon index of G = 2-2.5 in the MAXI GSC energy range • A spectral softening toward the Swift/BAT energy range Synchrotron peak around the MAXI range
Physical parametersassociated with the flares 2010 January 2010 February • Decay : td = 2.5 x 10⁴ s • td~ tcool • tcool = 1.5 x 10³ s B-3/2EkeV-1/2 d-1/2 • ⇒B = 0.045 G (d/10) -1/3 • Consistent with the previous results from SED • (B = 0.036 – 0.44 G; Kino et al.2002) • Rise : tr< 2 x 10 4 s • tr > light crossing time • ⇒R < ctcrsd / (1+z) • ~ 6 x 1015 cm (d/10) • Decay : td = 1.4 x 10⁵ s • ⇒B = 0.015 G (d/10) -1/3 • a week B field region ? • a superposition of 104 s flares ? • (Tanihata et al. 2004) • Rise : tr< 1.3 x 10 5 s • ⇒R < ctcrsd / (1+z) • ~ 4 x 1016 cm (d/10)
Spectral evolution associated with the flares Hard Hard 100 mCrab (Tanihata et al. 2004, Tremacere et al. 2009) G = 2.0 HR2 = F15-50 / F2-4 Synchrotron Peak [keV] G = 2.5 F2-10 [counts s-1 cm-2] Peak flux [ergs s-1 cm-2] B : magnetic field gp : peak electron Lorents factor d: beaming factor V : volume, Ne : electron number density • Peak Energy ~Bgp2d • Peak Flux~ B2gp2(2-Gp)d2+GpNeV
MAXI Blazars 2-4 keV 4-8 keV 8-16 keV 1.2 years 17 HBLs, 2 LBLs, 7 FSRQs, 8 Radio Galaxies (available at the MAXI web: http://maxi.riken.jp/top/)
MAXI Lightcurveof Blazars Mrk 501 (HBL) 1ES 1959+650 (HBL) ON 231/W Com (LBL) 10 mCrab 10 mCrab 2009 Oct. 1 2010 Jan. 1 Oct. 1 Nov. 1 Centaurus A (RG/SeyII) 3C 273 (FSRQ) 3C 454.3 (FSRQ) AGILE flare (ATEL2376) Fermi flare (ATEL2534) AGILE flare (ATEL2995) Fermi flare (ATEL2168) Fermi flare (ATEL2534) Fermi flare (ATEL2168) AGILE flare (ATEL2326)
Summary • MAXI is an ideal observatory for long-term X-ray monitoring observation of blazars. • MAXI has detected two strong X-ray flares from the HBL Mrk 421 on 2010 January and February. • The flux in the February flare is the highest ever reported from the object • From the shape of the MAXI lightcurve, the magnetic field associated with the flares were estimated • B = 0.045 G for 2010 January • B = 0.015 G for 2010 February • a superposition of several flare with a timescale of 104 s ? • The MAXI spectrum was found to hardest, when the flux is one third of the peak of the flare. • difficult to be interpreted within a simple one-zone framework.