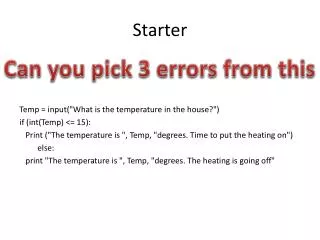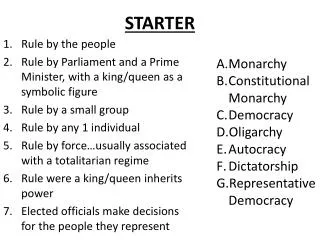
STARTER
STARTER. Read task 4 in the assignment and think about the user requirements of the piece of software. Produce a document entitled “Requirements Specification” and describe the user requirements of the new piece of software under the subheading “User Requirements”.

STARTER
E N D
Presentation Transcript
STARTER • Read task 4 in the assignment and think about the user requirements of the piece of software. • Produce a document entitled “Requirements Specification” and describe the user requirements of the new piece of software under the subheading “User Requirements”.
BTEC Unit 06 – Lesson 09Software Design Tools and Techniques Mr C Johnston ICT Teacher www.computechedu.co.uk
Session Objectives • Know how to use a range of different software design tools which can be used to design software.
Software Design Tools • Task 4 of the assignment requires you to produce a design for a piece of software, • STEP #1 – Produce a Requirements specification • inputs, outputs, processing, user interface, constraints (e.g. hardware platforms), timescales for development • STEP #2 – Design The Programs Components • Functions / procedures /objects, data structures • STEP #3 – Review against specifications requirements • Software design tools help us to specify and design our software programs • Tools we will need to use include • Structure diagrams including DFDs and ERM • Tools to define algorithms including using pseudo code and flow charts • Tools to design the user interface and outputs
Data Flow Diagrams • Data Flow Diagrams (DFDs) show how data flows into, around and out of a system, • They are made up of: • External data sources, people or organisations the system interacts with (eternal entities) • Flows of data, • Processes, • Data stores • Diagrams are spilt into different levels each painting a more detailed picture of what happens within a system • At level 0 they show the external data sources and how they interact with the system, • At higher levels they show the how the data is adapted by the system and where it is stored.
Context (Level 0) Diagrams • Show the external entities and how they interact with the system, • Diagram takes the format of a box called _____ system with the entities scattered around the system box, • Shape of the box will depend on the notation being used: • If a rectangle is used for the system then ellipses are used for the external entities • If an ellipse is used for the system then rectangles are used for the external entities • One way arrows enter and exit the system joining it with the external entities to show the data flows, • A label is then given to the arrow showing what data is flowing.
System Examples • Example context diagram using ellipse for system notation Example context diagram using rectangle for system notation
Drawing Diagrams • Start by reading a scenario and summarising what is going on into a table • Draw the diagram using the information in the table • Its convention that arrows go down the diagram in order of what happens
Example Reporting day data is complied by a system at Stringer. Staff enter grades into the system for each student which includes their ID, a current working at grade and effort for a subject. The system stores them, compares with past data and generates a grade report for parents. Summary information is also generated for year heads showing subject grades for each student in the year and one for form tutors summarising their tutees performance.
STUDENT DB Student ID Student Details Grade Information Student ID, working grade and effort Tutor group summary grades Year group summary grades STAFF REPORTING DAY SYSTEM PARENTS YEAR HEAD FORM TUTORS
Exercises An insurance company system takes details from customers which includes personal, car and past claim data. The information acquired is complied and pasted onto an external broker which generates quotes. On return from the broker the best quote is formatted appropriately and sent to the customer. The university and college admission system (UCAS) handles applications to higher education by students in the UK. Students submit data to the system which includes personal details, estimated grades, courses and institutions they want to apply for and a personal statement. A tutor also submits a reference for each student into the system. The system compiles each students application and forwards it onto the institution applied for. Upon receipt the staff at the university scrutinise the application and return to UCAS an offer or rejection – this is then passed onto the student.
Quotes Best Quote Personal, est grades, courses and inst. data and personal statement Reference Customer Information Personal, car, past claim data Offer / Reject Response To Applicant Applicant Information CUSTOMER BROKER INSURANCE SYSTEM TUTOR UCAS SYSTEM STUDENT INSTITUTION
Assignment Link Read task 4 of the assignment and produce a context diagram for the given scenario. Include a separate description of each external entity – • Who / what are they • How do they interact with the system, • Why are they necessary, • What information do they provide / receive and in what format
Level 1 Data Flow Diagrams • Level 1 diagrams expand the main box within the context diagram and show what happens to the data within the system • They are made up of external entities, data flows, processes and data stores, • They are drawn using a standard set of symbols • The data flowing into the system at level 1 must match the context diagram.
Level 1 DFD Components • External entities interact with the system (people etc) but not actually part of it – they put data into the system or receive from it. They are represented in an ellipse with their name clearly displayed • Data stores are where data is stored. Data can be written or read from a data store. On the diagram that have a sensible name and could be computerised or manual system such as filing cabinets • Data flows indicate the direction of information flowing around the system. They are labelled arrows with the head showing direction of flow. • Processes are activities which take place in the system – normally it involved some sort of transformation to the data and have at least one data input and output. Processes are numbered on the diagram in order and have a label which include a verb.
1 Add new customer Customer Customer Level 1 DFD Symbols External Entities – labelled with the name The ellipse with the slash across is used to repeat an entity later in the diagram to ensure its neat Processes – numbered and labelled with a verb Rectangle has number of process (this is in order which it happens) and a label which states the process – uses a verb M1 Customer File Data stores – labelled with a type, a number and the name Type is either M for manual or D for computerised store and the numbers counts up how many there are in the system Data Flows Arrow head shows the direction of the flow, should have a simple meaningful label describing the data
Drawing Diagrams • Start by reading a scenario and summarising what is going on into a table. Use the table drawn for the level 0 to help but notice this one has much more detail about the activities. Activities become processes and documents used become data stores
Example Reporting day data is complied by a system at Stringer. Staff enter grades into the system for each student which includes their ID, a current working at grade and effort for a subject. The system stores them, compares with past data and generates a grade report for parents. Summary information is also generated for year heads showing subject grades for each student in the year and one for form tutors summarising their tutees performance.
STAFF STAFF 1 Student ID, working grade and effort Student subjects retrieved from student database – new grades appended to grade database Student ID, subject ID, reporting day ID, working grade and effort Student ID STUDENT DB 2 D1 Grades Student Details New and old grades compared – comparison result appended to grade database working grade and effort STUDENT DB 3 Student ID working grade and effort PARENTS Student reporting day reports compiled Student Details Grade Information D1 Grades 4 YEAR HEAD working grade and effort Year group summary grades Summary reports produced grouping by year and tutor group STUDENT DB FORM TUTORS Student ID Tutor group summary grades Student Details Student ID working grade and effort grade comparison result
Summary • Read the scenario and work out the activities which go on within the system, • Draw the table listing the activities in order, what happens to the data and where it gets stored in the system, • Turn the table into a data flow diagram – • Activities become processes • Where the data is kept becomes data stores • Data flows connect the processes and data stores • Data enters and leaves the system to and from external entities • Check that the flows entering and exiting the system match what is on the level 0 diagram.
Exercises An insurance company system takes details from customers which includes personal, car and past claim data. The information acquired is complied and pasted onto an external broker which generates quotes. On return from the broker the best quote is formatted appropriately and sent to the customer. The university and college admission system (UCAS) handles applications to higher education by students in the UK. Students submit data to the system which includes personal details, estimated grades, courses and institutions they want to apply for and a personal statement. A tutor also submits a reference for each student into the system. The system compiles each students application and forwards it onto the institution applied for. Upon receipt the staff at the university scrutinise the application and return to UCAS an offer or rejection – this is then passed onto the student.
CUSTOMER 1 Personal, car and past claim data Collate customer details Collated customer details 2 D1 Customer File Send details to broker Collated details Broker details D2 Brokers quotes 3 BROKER Best quote selected and formatted and stored Formatted quotes Customer details D3 Quotes 4 quotes CUSTOMER Presented to the customer neatly Customer details Best quote D1 Customer File
STUDENT 1 Application Compiled Personal data, est. grades, courses, institution data and personal statement Complied Applications TUTOR Reference 2 D1 Applications Applications forwarded to institutions and status updated INSTIUTION Application Applicant Information Contact details D2 Institutions Response to application 3 Application status updated Status D1 Applications 4 Application with decision STUDENT Offer / Rejection letter compiled and sent Contact details Offer / rejection D2 Institutions Status update
Assignment Link Read task 4 of the assignment and produce a L1 diagram for the given scenario. Include a separate description of each process and data store – • What happens / what data is stored • Why are they necessary, Ensure that the diagrams match – do not invent any new data entering of leaving the system.
Final Quote Updates to materials and prices Brick type Wall height Wall width Waterproof sealant required More Help…. In groups think about what a L1 diagram for this situation might look like.. “Bob the builder builds walls for customers. To produce a quote for the customer he enters the wall height and width and selects the type of brick required. Some customers like outside walls water sealing, an option which bob also selects.” BOBs QUOTE SYSTEM BUILDERS MERCHANT BOB CUSTOMER
Describing the Processes The next task we need to do is describe the processes within out level 1 diagram We use shortened English to state what goes on during the process – start each statement with an action word, From our descriptions we can plan the code which needs to be written.
STAFF 1 Student subjects retrieved from student database – new grades appended to grade database Student ID, subject ID, reporting day ID, working grade and effort Student ID STUDENT DB D1 Grades Student Details Example Process working grade and effort Student ID Read studentID, Store studentID to variable studentID Using studentID find student subjects in STUDENT DB Read student subjects Store subjectID in variable subjectArray FOR each subjectID Read workingGrade Store workingGrade to variable workingGrade.subjectArray Read effort Store effort to variable effort.subjectArray End FOR Append subjectArray to Grades datastore An array is a 3D variable so for each subject can store its ID, workingGrade and effort like a table ICT, A, 1 BUS, B, 3 MAT, E, 5,
CUSTOMER 1 Personal, car and past claim data Collate customer details Collated customer details 2 D1 Customer File Send details to broker Collated details Broker details D2 Brokers quotes 3 BROKER Best quote selected and formatted and stored Formatted quotes Customer details D3 Quotes 4 quotes CUSTOMER Presented to the customer neatly Customer details Best quote D1 Customer File
Assignment Link • Based on the L1 dataflow diagram you have produced for the assignment describe each of the processes in the form of an algorithm, • Use the notation shown earlier and add annotation to make it clear what is happening, how it happens and how it meets the user requirements, • If done correctly this will form evidence for D2. BTEC Book – Unit 06 p27
D2 - Develop algorithms to represent a design solution • D2 requires you to develop algorithms to represent a design solution. These may be in any reasonable format as long as they are understandable. It is expected that you will annotate the algorithms to make it clear what they are doing and how they are doing it. The annotation should also indicate how the design requirements are being met.
Entity Relationship Diagrams • An entity is a person, place, event, or thing for which we intend to collect /store data • University -- Students, Faculty Members, Courses • Airlines -- Pilots, Aircraft, Routes, Supplier • Each entity has a number of characteristics known as attributes • Student – Student ID, Name, DOB, Home Address, • Aircraft – Aircraft Number, hours flown, last maintenance date, • Entities within an organisation are related to one another and are shown within a diagram • The diagram shows symbolically how the entities relate to one an other.
Entity Relationships • A relationship is a link or associations between entities. • Normally one dentist has many patients • There are three types of relationships: • One–to–One (one student has one address) • One–to–Many (one student has many grades) • Many–to–Many (one student has many students BUT one teacher has many students) • Due to database rules however we only use: One – to – Many relationships when designing data structures. • Any many-to-many relationships which you discover will need removing.
drives EMPLOYEE COMPANY CAR holds WARD PATIENT features ALBUM SINGERS Entity Relationships Diagrams • This is a way of showing relationships between entities, • Entity names are always written in capitals and appear in rectangles, • Lines join entities together and have: • Symbol to show the degree of the relationship, • A description to show the name of the relationship,
Many – To – Many Resolve • Many - to – Many relationships are not allowed so we have to resolve them: • To do this we introduce an additional entity between them splitting them up and creating 2 one - to – many relationships.
Quick Exercise • Draw an entity relationship diagram to show the relationship between • Product and Component (assume only 1 product is made) • House and Street • Pet Owner and Pet (assume each pet can only belong to a single owner) • Draw an entity relationship diagram providing a many – to – many resolve to show the relationship between • Product and Component (assume company makes lots of products) • Student and A-Levels in a school • Stock and Supplier in a newsagent (assume same stock are available from different suppliers)
Entity Key Attribute Data type Size STUDENT Primary StudentID Title First Name Second Name Post Code AutoNumber Text Text Text Text Auto 4chars 15chars 20chars 8chars Supporting Documentation • Once the ERD diagram is complete we then need to produce supporting documentation, • Supporting documentation involves a description of the relationship and thinking about individual data items stored within an entity – (an attribute), • Attributes have a name, a data type, rules, key fields will also be declared. • Attributes will be detailed in a table as shown below
Attribute Data Types • Attributes must be one of the following data types: • Text or String, • Numeric, • Date and Time, • Currency, • Boolean or Logical, • AutoNumber.
Attribute Data Types • Text or String: • Consists of a sequence of any characters, • Limited to 255 characters, • For longer text requirements you can use a memo data type. • Number: • Byte: 0 to 255 • Integer: -32,768 to 32,768 • Long Integer: 2,147,483,648 to 2,147,483,647 • Single: small decimal numbers (7dp) • Double: medium decimal numbers (15dp) • Decimal: large decimal numbers (28dp)
Attribute Data Types • Date and Time • General Date – 19/06/1994 17:34:23 • Long Date – 19 June 1994 • Medium Date – 19 – JUN - 94 • Short Date – 19/06/1994 • Long Time – 17:34:23 • Medium Time – 05:34 PM • Short Time – 17:34 • Currency • Offers more precision for storing prices • Boolean / Logical • True, False • On, Off • Yes, No
Using The Correct Data Types • You must ensure that the correct data type is chosen for an attribute • The larger the maximum value the more memory in the database is taken up • E.g phone numbers don’t need to be calculated with so can be stored as text • For the award of M3 in this unit you need to select the correct data type for fields and justify their choice.
holds WARD PATIENT Key Fields • Each entity will have a primary key – this is a unique identifier for each set of data within it, • To join one entity to another we use a foreign key, • This is the primary key from the entity whose relationship is one, in the table whose relationship is many patientID wardID wardID
Quick Exercise Justify the choice of fields, data type and size for each of the fields shown in the data dictionary.
Validation Rules A 5th column can be added to our database design which contains validation rules. A validation rule is to check that the data entered is of the correct type and meets certain specified criteria. Validation rules can check: The data has been entered (presence check) The data entered is within a specific range of values, (range check) e.g. > 90 AND < 250 The data entered matches a pattern of characters (picture check) e.g. postcode: L?09 0LL telephone number: (00000) 000000 The data entered is from a list of allowed values (list of valid values) e.g. “U” OR “PG” OR “12A” OR “15” OR “18”
Entity Key Attribute Data type Size Validation STUDENT Primary StudentID Title First Name Second Name Post Code AutoNumber Text Text Text Text Auto 4chars 15chars 20chars 8chars Mr, Mrs, Miss, Ms Required Required L?09 L00 The Data Dictionary • A data dictionary for a student may look like:
Entity Key Attribute Data type Size Validation Justification Assignment Link • Based on the L1 dataflow diagram you have produced for the assignment draw an ERD to show the required entities and a data dictionary to show the fields required, • For each field select an appropriate data type and size, • Justify the inclusion of all fields, data type and sizes if done correctly this will form evidence for M2 – • Modifying the table shown earlier will help BTEC Book – Unit 06 p23
M2 - Justify the choice of data types and software structures used in a design solution. • Evidence for M2 can be included within the design documentation and based on the data types used in the design. • When working towards M2 remember that your justification of the choice of data type will need to cover why you chose the data types you did, what the alternatives were and why you did not consider them suitable. In some cases this will be quite straightforward, for example where text input is made. However, with numeric datayou will need to consider not only if the value will be integer only or if a floating point data type is required, but also the likely range of values the variable will hold.
Input Screen Designs(1) • Input screens are used to enter data into a computer system, • They are usually forms with controls on them which allow users to type or select the data to enter, • Sometimes values will appear automatically or as a result of another entry, • Validation rules on entry forms prevent users from leaving key fields blank or entering data of the wrong type – if setup within the database table these rules will be transferred.
Input Screen Designs(2) • Form Controls What is each control used to enter?