1 / 7

Progressione centri attivati vs pz . trattati

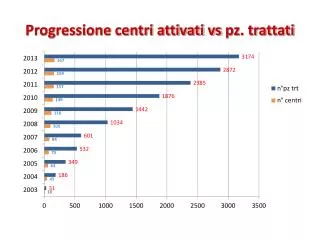
Progressione centri attivati vs pz . trattati. Time logistics. Demographic and baseline data. Clinical outcome at 3 months. Symptomatic intra- cranial hemorrhage. Clinical outcome at 3-months ( bNIHSS≥10; median 16). Quanti pazienti dovremmo trattare?.

kibo-dudley
Télécharger la présentation

Progressione centri attivati vs pz . trattati

An Image/Link below is provided (as is) to download presentation Download Policy: Content on the Website is provided to you AS IS for your information and personal use and may not be sold / licensed / shared on other websites without getting consent from its author. Content is provided to you AS IS for your information and personal use only. Download presentation by click this link. While downloading, if for some reason you are not able to download a presentation, the publisher may have deleted the file from their server. During download, if you can't get a presentation, the file might be deleted by the publisher.

E N D

Presentation Transcript


  1. Progressione centri attivati vs pz. trattati

  2. Timelogistics

  3. Demographic and baseline data

  4. Clinicaloutcomeat 3 months

  5. Symptomatic intra-cranialhemorrhage

  6. Clinicaloutcomeat 3-months (bNIHSS≥10; median16)

  7. Quanti pazienti dovremmo trattare? Incidenza Ictus ischemico in Italia Totale 167.000 Nuovi casi 134.000 Recidive 33.000 ~50% non trattabili 16.000 ≤ 4.5 h 50% ≤ 4.5 h 50% ≤ 3 h 30% ≤ 3 h 30% ~40.000 ~65.000 ~8.000 ~5.000 Trattabili con tPA per RCP ~ 25% ~1.200 ~2.000 ~10.000 ~16.000 30% 2.400 ~10.000 – 18.000 pz./anno Range 21.900 19.500 3.174/21.900 = 14.5%

More Related