Download
1 / 22
220 likes | 349 Vues
Fuel Economy in Harris County-2007. Graciela Lubertino, PhD. Reason for Study. H-GAC contacted by City of Houston to do a regional fuel economy study for 2007 Aim is to determine how much fuel is consumed daily and how the mayor’s plan of reducing fuel usage 5% by 2010 can become feasible.

E N D
Fuel Economy in Harris County-2007 Graciela Lubertino, PhD
Reason for Study • H-GAC contacted by City of Houston to do a regional fuel economy study for 2007 • Aim is to determine how much fuel is consumed daily and how the mayor’s plan of reducing fuel usage 5% by 2010 can become feasible.
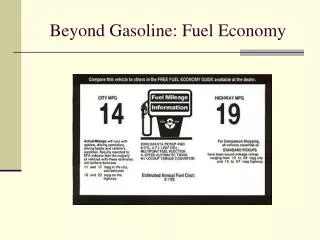
Calculation Methodology-Inputs • 2006 Harris county registration distribution (TxDOT)- An array of 16 composite vehicle (aggregated diesel and gasoline) for a 25 year period. • 2006 regional diesel fractions (TxDOT)- represent the fraction of diesel in a composite vehicle category. • 2007 VMT mix data (TTI)- fraction of VMT per road type and per 28 vehicle types. • Fuel economy table for MOBILE6 vehicle type (EPA)- per 28 vehicle type and model year. • 2007 VMT per hour, per vehicle type (H-GAC) • 2007 VMT per link (H-GAC)
Relation between 16 composite and 28 disaggregated vehicle classes
Methodology • Split of composite vehicle categories: • Reg_Dist LDGV = Reg_Dist LDV x (1 – Diesel_Fraction LDV) • Reg_Dist LDDV = Reg_ Dist LDV x Diesel_Fraction LDV
Methodology {Reg. Dist} x {VMX}|am,md,pm,ov= {C}|am, md, pm,ov (25x28) (28x15) (25x15) {C}t|am, md, pm,ov x {MPG} = {E}|am, md, pm,ov (15x25) (25x28) (15x28) The {VMX} matrix represents the percentage of 28 different vehicle types on the 15 types of roads (urban interstate, urban other freeway, toll roads, ramps, urban principal arterial, urban other arterial, urban collector, local-centroid connector, rural interstate, rural other freeway, rural principal arterial, rural other arterial, rural major collector, rural collector, and local intrazonal)
Methodology • {E}|am, md, pm,ov = represents the fuel economy weighting average over the 25 years distribution for the 28 vehicle types on the 15 facility types. • Each element of this matrix was then inverted to get gallons/mile and multiplied by the hourly VMT (output from IMPSUM program) to get the total fuel consumption for each vehicle category, road type and hour of the day.
Daily Fuel Consumption and Fuel Economy for each of the aggregated roadway types
Daily Fuel Consumption by Roadway Type Freeway Arterial Collector 11% 44% 45% Daily Fuel Consumption by Roadway Type
Conclusions • On an average weekday, approximately 5,000,000 gallons of fuel is consumed in Houston. • Gasoline consumption is approximately four times more than diesel consumption. • Light duty gasoline vehicles clearly dominate the VMT and the fuel consumption. • The fuel economy is almost constant during the day, with the best occurring during peak periods and the worst during midday. These facts are primarily due to changes in the proportion of heavy duty and light duty traffic volumes. • Diesel traffic tends to be highest on collectors, while gasoline vehicles tend to travel the most on freeways
Conclusions on 2002 and 2009 results • The overall fuel economy improved from 2002 to 2009 by 1.3% due to fleet turn over and an increased of LDG vehicles by 2% and a decreased of HDG by 2% • The VMT increased by 19% between 2002 and 2009, which shows an increment of 2.7% per year. • The total daily fuel consumption increased by 18% from 2002 to 2009 due to the increased in VMT since the increase in fuel economy is almost negligible. • The plots for hourly VMT and fuel economy follow the same pattern as for 2007. • Daily fuel consumption by road type increased in freeways by 3%, while it decreased in arterials by 3% from 2002 to 2009. This is mainly because the VMT has increased on freeways by 27% from 2002 to 2009, while the VMT on arterials has increased only by 14%.
Further Conclusions • This study shows that the effect of fleet turn over is almost negligible since the CAFÉ standards have not change for 20 years. • Overall fuel consumption and VMT increased by about 2.7% per year from 2002 to 2009.
Recommendations • Accelerating the implementation of new CAFÉ standards by 2010 instead 2020, making it at least 40 mpg. • Aggressive implementation of transit, hybrid vehicles, commute solutions, and moving freight by rail. • To view full report, please go to: http://www.h-gac.com/taq/airquality/studies/docs/MPG_city_documentation_edit.pdf
Other Air Quality Issues • Control strategies for On-road and non-road mobile sources to be included in the up coming SIP for the 1997 8-hr ozone standard (0.08 ppm) • EPA approved a new 8-hr ozone standard (0.075 ppm) – called 2008 8hr ozone standard • Working on automated air toxics calculations
Conformity News • Done conformity to the 2035 plan on November 2007 • Done a finding of consistency due to changes of METRO projects (BRT to LRT) on the 2008-2011 TIP on April 2008 • Done a conformity amendment due to revisions of the 2008-2011 TIP (projects delayed) on June 2008