Download
1 / 22
220 likes | 365 Vues
Energy Efficiency Around the World Norberto Medeiros, Chair WEC Brazil MC World Energy Council. What is Energy Efficiency?. Reduction in the energy used for a given service Technological changes and non-technical factors Energy used to produce one unit of GDP

E N D
Energy Efficiency Around the World Norberto Medeiros, Chair WEC Brazil MC World Energy Council
What is Energy Efficiency? • Reduction in the energy used for a given service • Technological changes and non-technical factors • Energy used to produce one unit of GDP • Reductions in energy use are not energy efficiency
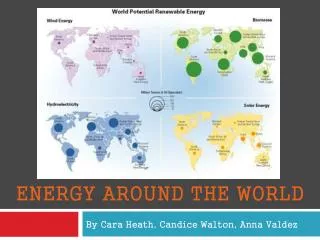
A Wide Range of Opportunities • Behavior, individual choices • Efficient and cost-effective technologies • Many opportunities in the residential sector • 70% in developing countries • Technology transfer, capacity building
Energy Efficiency Trends • Improvements industry-driven in OECD • Converging industry trends due to globalisation • Trade-offs in transport • Continued rapid growth of electricity use in households • Electricity intensity of the service sector is increasing
Energy Efficiency Trends • Tripling the energy intensity levels among world regions • Higher GDP for less energy resulting in large energy savings at the world level • In less developed regions, the energy intensity is decreasing slower if biomass is excluded • About 20% of end-use efficiency improvements are offset by higher conversion losses • Energy efficiency of thermal power generation is improving slowly at world level
Energy Efficiency Trends • Final intensities are generally decreasing with economic development and converging • Changes in economic structure also influence final energy intensities: services require six times less energy inputs per unit of value added than industry • In transport great disparities exist among regions in the energy intensity trends; certain interesting signals in some OECD countries with a stabilisation of transport energy use
Energy Efficiency Trends • The household electricity consumption per capita is rising and showing diverse trends • One fifth of the world’s population accounts for about 60% of world CO2 emissions • CO2 emissions from energy combustion doubled since 1990 in non-OECD Asia • CO2 emissions generally increase less rapidly than output
CO2 emissions per capita Energy Efficiency Trends
Europe Europe’s TPES 81.1 Exajoules Total end-use 50.2 Exajoules Early rewards have been exhausted 20% potential reduction in energy demand by 2020 A good example to the world with 25% savings potential
How does Europe do it? District Heating and Cooling • Waste heat recovery • Public-private partnerships • A 6% increase in use of DH = - 9.3% in CO2 Combined Heat and Power (CHP) • Co-generation plant in Belgium supplies 200,000 households • 60 CHP plants for Spanish pulp and paper sector
How does Europe do it? Municipal Waste to Produce Energy • Unicem’s Cement kiln in Italy • 20% of energy from local municipal waste • 70,000 tonne CO2 per year Low Rolling Resistance Tyres • Tyres consume 20% • Introduction of silica in 1993 • 50% of car tyres on the replacement market in Europe
How does Europe do it? Eco-Driving • Reduction of 25% for individual drivers after training • 10% in the long term • Reduction potential of 50Mt CO2 by 2010 Advanced insulating glass units • One m2 double glazing = +25 kg of CO2 • Replacing one m2 of single glazing by double = -91kg of CO2 per year • CO2 recovery in less than four months
How does Europe do it? Efficient motors • 65% of electricity in the EU industrial sector • 90% can be saved by adjusting motor speed • 10% equipped with variable speed drives Lighting • 14% of electricity in the EU • 2/3 old low-efficiency technology
Policy Instruments for Cars Energy Efficiency • Road pricing • Car labels for fuel consumption and CO2 emissions • Car scrapping • Biofuels • Fiscal Measures on Cars - Car Purchase Tax - Car registration tax - Taxation of Motor Fuels
Gasoline tax index in relation to income tax for 1,000 litres to the GDP per head
Conclusions & Recommendations • Incentive pricing • Stable institutional framework • Packages of measures • Public/private partnerships • Properly applied regulations • Public sector to lead • Certification and testing
Conclusions & Recommendations • Developing countries involvement • Cover all areas with potential for energy savings • Tailor to individual countries’ needs • International coordination • Integrate energy efficiency in all policies • Evaluation using indicators
World Energy Council The World Energy Council provides a unique forum for the discussion and sharing of experiences among different countries and stakeholders thus facilitating the introduction and deployment of energy efficiency policies and measures