Download
1 / 23
270 likes | 562 Vues
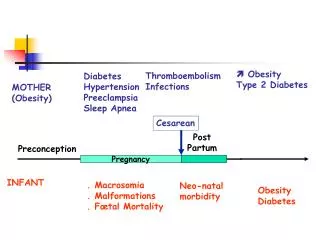
Cesarean. Post Partum. Preconception. Pregnancy. INFANT. . Macrosomia . Malformations . Fœtal Mortality. Neo-natal morbidity. Obesity Diabetes. Obesity Type 2 Diabetes. Thromboembolism Infections. Diabetes Hypertension Preeclampsia Sleep Apnea. MOTHER (Obesity).

E N D
Cesarean Post Partum Preconception Pregnancy INFANT . Macrosomia . Malformations . Fœtal Mortality Neo-natal morbidity Obesity Diabetes Obesity Type 2 Diabetes Thromboembolism Infections Diabetes Hypertension Preeclampsia Sleep Apnea MOTHER (Obesity)
Maternal BMI and Hypertension Preeclampsia (OR) 2.7 1.7
Changes in BMI between the 2 first pregnancies influence the rate of gestational diabetes during G2 + 200 % + 100 % + 30 % // + 7 + 20 kg + 2 + 6 kg + 1 + 3 kg = 0 63 kg/165 cm (BMI 23 kg/m²) BMI > 30 Changes in BMI units (kg/m²) between G1 et G2) Villamer E, 2006
Mean blood glucose values of pregnant women with gestational diabetes Blood glucose not controlled Blood glucose controlled p • n • FBG (mg/dl) • 2 h postprandial (mg/dl) • Breakfast • Lunch • Dinner 1.188 97.3 + 11.4 110.9 + 15.5 130.5 + 14.8 123.7 + 13.8 2.030 82.9 + 7.3 96.1 + 9.9 102.4 + 13.4 106.5 + 8.0 < 0.001 < 0.001 < 0.001 < 0.001 Data are means + SD (number of blood glucose measurements : 27000 to 36000 for each mean Victor Hugo Gonzalez-Quintero et al, Diabetes Care 2007
Neonatal outcomes Blood glucose not controlled Blood glucose controlled p • n • Birth weight (g) • Macrosomia (%) • Cesarean delivery • Neonatal intensive care • Neonatal hypoglycemia • Composite outcome 1.188 3.491 + 532 15.7 48.5 10.6 9.3 33.1 2.030 3.364 + 481 9.3 37.4 7.3 7.1 24.0 0.001 0.001 < 0.001 0.002 0.031 < 0.001 Victor Hugo Gonzalez-Quintero et al, Diabetes Care 2007
Maternal characteristics Blood glucose not controlled Blood glucose controlled p • n • Maternal age (years) • Prepregnancy BMI • (kg/m²) • Obese BMI (%) • (> 35 kg/m²) • Received insulin (%) 1.188 31.3 + 5.5 32.0 + 8.2 29.1 58.4 2.030 31.0 + 5.7 28.0 +6.8 13.4 23.7 0.571 < 0.001 < 0.001 < 0.001 Victor Hugo Gonzalez-Quintero et al, Diabetes Care 2007
% Insulin Respective influences of maternal weight and gestational diabetes on macrosomia CONTROL Good Bad % Diet Langer O, Am J Obstet Gynecol 2005, 192, 1768
Respective influences of maternal weight and gestational diabetes on cesarean section rates CONTROL Good % Bad % Diet n = 1744 Insulin n = 2254 Langer O, Am J Obstet Gynecol 2005, 192, 1768
Maternal effects of weight increase during pregnancy in obese women tolerant to glucose % 40 30 Hypertension 20.5 % 20 17 40 36 10 12 32 10 28 30 20 Induced labour 20 % 40 35 10 28 30 27 < 5kg 5–9.9kg 10-14.9kg > 15 kg Cesarean section 20 Gestational weight increase 15 10 5–9.9kg < 5kg 10-14.9kg > 15 kg Gestational weight increase Jensen, Diabetes Care, 2005
Foetal effects of weight increase during pregnancy in obese women tolerant to glucose % 40 35 33 29 30 % Weight > 4 kg 19 20 20 10 15 Intra uterine growth retardation % 10 4 40 3 33 2 1 30 25 23 < 5kg 5–9.9kg 10-14.9kg > 15 kg Macrosomia 20 Gestational weight increase 13 10 5–9.9kg < 5kg 10-14.9kg > 15 kg Gestational weight increase Jensen, Diabetes Care, 2005
OBESITY AND MALFORMATIONS
Maternal obesity and central nervous system malformations Adjusted OR 2.6 2.3 2.8 2.7 95 % IC 1.7 - 4 1.2 - 4.3 1.7 - 4.5 1.5 - 5 N 254 97 157 103 Malformations Neural tube Anencephalia Spina bifida Hydrocephalia BMI ≥ 30 kg/m² versus 18.5 – 24.9 kg/m² Anderson JL, Epidemiology 2005, 16, 87
Maternal obesity, gestational diabetesand SNC malformations Gestational diabetes Yes No OR SPINA BIFIDA Anderson JL, Epidemiology 2005, 16, 87
Pregestational BMI predicts the risk of malformations in infants born from mothers with gestational diabetes OR 3 2 1 0 Controls < 21 21 - 25 25 - 30 > 30 BMI (Kg/m²) Martinez-Frias ML, Diabet Med, 2005, 22, 775
Prepregnancy management of obese women Motivation ? • Complications • infertility • metabolic : diabetes ? • cardiovascular • Eating disorders ? • Target weight • Exercice and dietary recommandations ? • Treatments ? • Bariatric surgery ?
Pre-pregnancy gastric banding D'après Skull et al, Obes Surg 2004
PREGNANCY AFTER GASTRIC BANDING Obese women After banding Paired Previous pregnancy Controls (before banding) N Initial BMI (kg/m²) Weight loss (before) Weight gain (pregnancies) Gestational Diabetes (%) Hypertension (%) Preeclampsia (%) Macrosomia (%) N = 40 45 + 14.4 + 9 kg 15 45 28 11 N = 79 44 + 15.5 + 9 kg 19 38 25 18 • N = 79 • 46 • 28 + 14 kg • + 9.6 + 9 kg • 6.3 • 10 • 5 • 11 Dixon et al, Obstet Gynecol 2005
Offspring Weights before and after maternal by-pass surgery by duodenal switch Weight Group Normal weight, n (%) Overweight, n (%) Obese, n (%) Underweight, n (%) Before surgery (n = 45) 16 (36) 9 (20) 18 (40) 2 (4.4) After surgery (n = 172) 98 (57) 28 (16) 33 (19) 13 (7.5) p = 0.006 Kyal JG, Pediatrics, 2007
Management during pregnancy • Diagnosis of diabetes : optimal intervals for fasting and 2 hours post prandial blood glucose ? For OGTT tests ? • Cardiovascular and respiratory assessment • Weight increase (# 5 kg) • Ultrasonographic follow-up
Optimal diagnosis of gestational diabetes in obese women ? When ? At 24th week ? Which OGTT ? .Oral glucose 50g, 75g, 100 g ? . Times for samples ? . Venous or capillary blood ? Units ? . Various tresholds depend on types of morbidity - fœtal - maternal - long term outcomes Risk of underestimate Gestational diabetes Too soon Type 2 diabetes Too late Obese need tests abble to be repeated at least monthly… Frequency of glycemic control ? . Fasting BG : 95 mg/100 ml . Post prandial BG : 120 mg/100 ml (2 hrs)
Gestational diabetes prevalence and risk of macrosomia IMPACT OF DIAGNOSTIC CRITERIA Gestational Diabetes % Risk of Macrosomia % Canadian EASD ADA New Zealand WHO Australian 6.3 7.6 8.4 17 15 23 2.01 1.57 2.09 1.92 1.26 1.53 Agarwal MM, Diabetic Medicine 2005
Prepregnancy BMI has a greater population impact on pregnancy outcomes than gestational hyperglycemia(n = 9270) Population attribuable risks of pregnancy outcomes For BMI or GDM Macrosomia Hypertension 23 % 3.8 % 50 % 9.1 % BMI > 26 kg/m² (upper quartile) Gestational Hyperglycemia Ripart W. Diabetologia 2005