Download
1 / 14
140 likes | 227 Vues
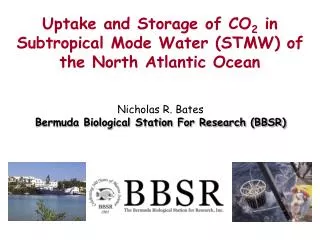
Uptake and Storage of CO 2 in Subtropical Mode Water (STMW) of the North Atlantic Ocean. Nicholas R. Bates Bermuda Biological Station For Research (BBSR). STMW Carbon Uptake and Storage.

E N D
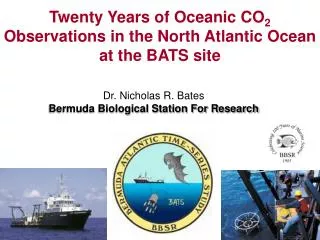
Uptake and Storage of CO2 in Subtropical Mode Water (STMW) of the North Atlantic Ocean Nicholas R. Bates Bermuda Biological Station For Research (BBSR)
STMW Carbon Uptake and Storage • The magnitude and interannual variability of uptake and storage of carbon dioxide (CO2) and storage into mode waters are poorly quantified. N.R. Bates, A.C Pequignet, and R.J. Johnson Bermuda Biological Station For Research North Atlantic Subtropical Mode Water (STMW) Source: Talley, 2000
STMW in the North Atlantic Ocean 4°C 18°C 25°C 18°C Generic winter location of STMW formation Gulf Stream Geostrophic recirculation pathways of STMW Interannual variability of STMW formation is primarily associated with climate variability (i.e. North Atlantic Oscillation, NAO) February SST composite image source: Norm Nelson, UCSB
Interannual Variability of CO2 STMW TCO2 Surface TCO2 • Mixed layer TCO2 (µmoles kg-1 yr-1) TCO2 +1.20 + 0.35 (r2= 0.36*) nTCO2 +1.19+ 0.25 (r2= 0.37*) DO -0.10 + 0.24 (r2= 0.00) • STMW TCO2 (µmoles kg-1 yr-1) TCO2/nTCO2+2.22+ 0.27 (r2= 0.65) DO -0.58 + 0.22 (r2= 0.27) Source: Bates et al., 2002
Non-steady state changes in CO2 • Higher winter wind speeds in 1990’s compared to 1980’s GEOSECS data TTO dataKeeling dataBrewer data BATS data * * * * * * Extensive STMW formation
Increased Oceanic CO2 Sink in 1990’s • Annual global ocean uptake of CO2 is about 2 Pg C yr-1. • Over the last 12 years, the extra uptake of CO2 into STMW (~ 0.6 to 2.8 Pg C) has the same range as the global annual uptake of CO2. • Since 1988, STMW has taken up (~ 0.05 to 0.23 Pg C yr-1). This is ~3 to 11% of the best estimate of annual uptake of CO2 into the global ocean. 3-11% of global CO2 uptake 20°N 40°N
Causes for changes in CO2 • 1. Remineralization of OM (sampling older water over time) • 2. Changing flux of CO2 through gas exchange • 3. Retention of CO2 or loss from STMW (by mixing) 2 BATS 3 1 20°N 40°N Source: Bates et al., 2002
Increase in Remineralization Rate? DO -0.58 + 0.22 µmoles kg-1 yr-1 (r2= 0.27) Nitrate -0.02 + 0.02 µmoles kg-1 yr-1(r2= 0.15) Phosphate -0.00 + 0.00 µmoles kg-1 yr-1 (r2= 0.13) [Temperature +0.003 + 0.004 °C yr-1 Salinity +0.002 + 0.000 yr-1] • STMW TCO2 changes not due to remineralization (i.e., decrease in DO) or sampling of older water. Source: Bates et al., 2002
Increase in Remineralization Rate? DC +2.22 (µmoles kg-1 yr -1) DCant +0.90 (µmoles kg-1 yr -1) DCgasex +1.19+ 0.26 (µmoles kg-1 yr -1) (r2= 0.47) DCbio +0.28+ 0.12 (µmoles kg-1 yr -1) (r2= 0.25) • Low DCbio values indicate that biological processes did not contribute much to the +2.2 µmoles kg-1 yr -1 change in STMW TCO2 Source: Bates et al., 2002
Increased Gas Exchange? • Higher winter wind speeds in 1990’s compared to 1980’s GEOSECS data TTO dataKeeling dataBrewer data BATS data CO2 gas flux at the site of STMW formation should increase STMW by 2-3 µmoles kg-1 yr-1. Mean winter wind speed Mean annual wind speed • Higher winter wind speeds in 1990’s compared to 1980’s
Variability of Carbon Storage? • Higher winter wind speeds in 1990’s compared to 1980’s GEOSECS data TTO dataKeeling dataBrewer data BATS data * * * * * * * * * * * Extensive STMW formation
NAO-ve State NAO+ve State 1960’s, 1970’s, early 1980’s: CO2 in STMW redistributed Post 1987: CO2 transferred to ocean interior Short-term CO2 sink ~1-4 years Long-term CO2 sink >10 years
Conclusions: •Apparent coupling between modes of climate variability such as NAO and CO2 uptake and storage in the subtropical gyre. • Since 1988, ~0.6-2.8 Pg (1015 g) of extra CO2 has accumulated within the gyre STMW layer. This represents a longer term oceanic sink of CO2 (>10 years) in the 1990’s compared to earlier decades, and 3-11% of global ocean flux? Image Source: BBSR
Acknowledgements: Thanks to: All the present and past BATS technicians Crew and captains of the R/V Weatherbird II Bermuda Biological Station For Research (BBSR) Anthony H. Knap, Anthony F. Michaels, Rodney J. Johnson, Dennis A. Hansell, Debbie Steinberg, Craig A. Carlson, Michael Lomas, Niki Gruber, Ocean CO2 and JGOFS community


![EDT1-EDDY Center [mg/m -2 /day -1 ] Depth Mass C-Flux N-Flux](https://cdn2.slideserve.com/4289367/slide1-dt.jpg)