Trends in Commercial Auto and General Liability
510 likes | 808 Vues
Trends in Commercial Auto and General Liability. Joseph M. Palmer, FCAS, CPCU Assistant Vice President Increased Limits & Rating Plans Division Insurance Services Office, Inc. . Commercial Automobile Overview. Latest Basic Limit Trends Higher Limits Trends Recent History

Trends in Commercial Auto and General Liability
E N D
Presentation Transcript
Trends in Commercial Auto and General Liability Joseph M. Palmer, FCAS, CPCU Assistant Vice President Increased Limits & Rating Plans Division Insurance Services Office, Inc.
Commercial Automobile Overview • Latest Basic Limit Trends • Higher Limits Trends • Recent History • Frequency Trends • ILF Review Trends • Loss Layer Trends
Commercial Auto Liability Severity Trends • Trends Based on Calendar Year Data Through Latest Evaluation (9/30/2002) • State Data Credibility Weighted With Multistate Data • 24-pt. & 12-pt. (Quarterly) Fits Examined • 12-pt. Fits Generally Used • Incurred Data Also Examined
Commercial AutomobileBodily Injury • Data Through 9/30/2002 • Paid Loss Data --- $25,000 Limit • 12-point: + 3.8% • 24-point: + 3.0%
Commercial AutomobileBodily Injury • Data Through 6/30/2002 • Incurred Loss Data --- $25,000 Limit • 12-point: + 3.9% • 24-point: + 3.9%
Commercial AutomobileBodily Injury • Data Through 9/30/2002 • Paid Loss Data --- $100,000 Limit • 12-point: + 4.9% • 24-point: + 4.1%
Commercial AutomobileBodily Injury • Data Through 6/30/2002 • Incurred Loss Data --- $100,000 Limit • 12-point: + 5.7% • 24-point: + 5.2%
Commercial Auto Bodily InjuryHistory of 25K and 100K TrendsMarch, 1999 through Oct. 2002
Commercial AutomobileBodily Injury • Data Through 9/30/2002 • Paid Loss Data --- $1 Million Limit • 12-point: + 6.8% • 24-point: + 6.7%
Commercial AutomobileBodily Injury • Data Through 9/30/2002 • Paid Loss Data --- Total Limits • 12-point: + 7.5% • 24-point: + 7.1%
Commercial AutomobileBodily Injury • Data Through 6/30/2002 • Incurred Loss Data --- Total Limits • 12-point: + 6.6% • 24-point: + 6.5%
Commercial Auto Bodily InjuryHistory of 1 Million and Total Limits TrendsMarch, 1999 through Oct. 2002
Commercial Automobile Property Damage • Data Through 9/30/2002 • Paid Loss Data --- Total Limits • 12-point: + 6.8% • 24-point: + 5.7%
Commercial Automobile Property Damage • Data Through 6/30/2002 • Incurred Loss Data --- Total Limits • 12-point: + 5.4% • 24-point: + 5.0%
Commercial Auto Property DamageHistory of Total Limits TrendsMarch, 1999 through Oct. 2002
Commercial Automobile Statewide Variation • Bodily Injury Severity • Low Statewide Credibility • All Commercial Auto Data used in analyses • Only 4 States with Greater than 15% Credibility • Limited Variation between States after Trends are Credibility-Weighted
Commercial Automobile Bodily Injury Frequency Trends3/31/1996 through 12/31/2001
Commercial Automobile Property Damage Frequency Trends3/31/1996 through 12/31/2001
Commercial Automobile Policy Limit Distribution • ISO Database Composition: • 70% at $1 Million Limit • 5% at $300,000 Limit • 15% at $500,000 Limit • 5% at $2 Million Limit • Varies by Table
Commercial AutomobileBodily Injury Excess Trends • Data Through 9/30/2002 • Paid Loss Data --- Excess Limits • $400,000 xs $100,000 • 12-point: + 9.0% • 24-point: + 9.4%
Commercial AutomobileBodily Injury Excess Trends • Data Through 9/30/2002 • Paid Loss Data --- Excess Limits • $500,000 xs $500,000 • 12-point: + 11.0% • 24-point: + 14.9%
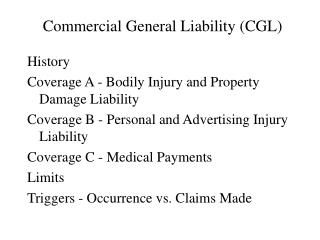
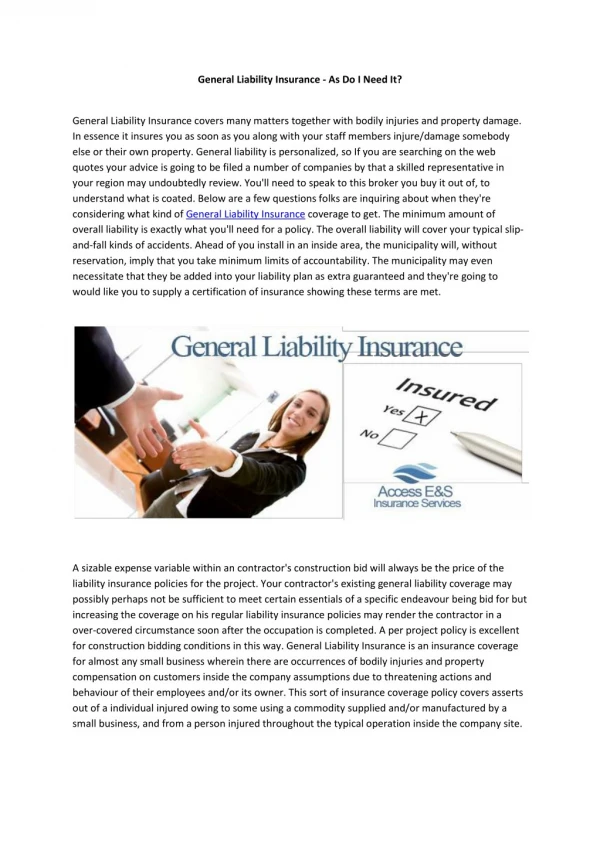
General LiabilityOverview • Latest Trends --- Basic, Total, ALAE • Recent History • Frequency Trends • ILF Review Trends
General Liability --- Severity • Trends Based on Accident Year Paid Experience (including ALAE) • Recent Points Heavily Dependent on LDFs • 10-yr., 8-yr., & 6-yr. Fits Examined to Select Severity Trend Factor • Multistate Review --- Separately by Subline • Stability is a Concern
General Liability --- OL&T BI Severity Trends (10 yr.) • $100,000 Indemnity • + 3.1% • ALAE • + 6.3% • Losses and ALAE • $100,000 Limit: + 4.0% • Total Limits: + 5.4%
General Liability --- OL&T PD Severity Trends (10 yr.) • $100,000 Indemnity • + 6.1% • ALAE • + 10.5% • Losses and ALAE • $100,000 Limit: + 8.2% • Total Limits: + 8.6%
General Liability OL&T Severity TrendsCalendar 1997 through Fiscal 2003
General Liability --- M&C BI Severity Trends (10 yr.) • $100,000 Indemnity • + 2.3% • ALAE • + 5.6% • Losses and ALAE • $100,000 Limit: + 3.6% • Total Limits: + 4.7%
General Liability --- M&C PD Severity Trends (10 yr.) • $100,000 Indemnity • + 6.7% • ALAE • + 7.1% • Losses and ALAE • $100,000 Limit: + 6.8% • Total Limits: + 7.2%
General Liability M&C Severity TrendsCalendar 1997 through Fiscal 2003
General Liability --- Products BI Severity Trends (10 yr.) • $100,000 Indemnity • + 2.3% • ALAE • + 7.8% • Losses and ALAE • $100,000 Limit: + 5.2% • Total Limits: + 4.3%
General Liability --- Products (a) BI Severity Trends (10 yr.) • $100,000 Indemnity • + 2.6% • ALAE • + 12.4% • Losses and ALAE • $100,000 Limit: + 8.2% • Total Limits: + 7.1%
General Liability --- Products PD Severity Trends (10 yr.) • $100,000 Indemnity • + 4.2% • ALAE • + 7.4% • Losses and ALAE • $100,000 Limit: + 5.8% • Total Limits: + 5.4%
General Liability --- Products (a) PD Severity Trends (10 yr.) • $100,000 Indemnity • + 7.0% • ALAE • + 10.6% • Losses and ALAE • $100,000 Limit: + 8.8% • Total Limits: + 10.2%
General Liability --- LP/CO BI Severity Trends (10 yr.) • $100,000 Indemnity • + 3.7% • ALAE • + 9.3% • Losses and ALAE • $100,000 Limit: + 6.3% • Total Limits: + 8.7%
General Liability --- LP/CO (a) BI Severity Trends (10 yr.) • $100,000 Indemnity • - 2.4% • ALAE • - 0.8% • Losses and ALAE • $100,000 Limit: - 1.5% • Total Limits: - 2.4%
General Liability --- LP/CO PD Severity Trends (10 yr.) • $100,000 Indemnity • + 6.5% • ALAE • + 8.8% • Losses and ALAE • $100,000 Limit: + 7.4% • Total Limits: + 7.4%
General Liability --- LP/CO (a) PD Severity Trends (10 yr.) • $100,000 Indemnity • + 9.8% • ALAE • + 12.1% • Losses and ALAE • $100,000 Limit: + 10.9% • Total Limits: + 9.8%
General Liability Policy Limit Distribution • ISO Database Composition: • 85% at $1 Million Limit • 4% at $500,000 Limit • 5-6% at $2 Million Limit • 1-2% at $5 Million Limit
Sample Definition of Construction Defects A construction defect is “the failure of the building or any building component to be erected in a reasonably workman like manner or to perform in the manner intended by the manufacturer or reasonably expected by the buyer, which proximately causes damage to the structure.” (CA State Jury Instructions)
Types of Defects Many courts have recognized two primary categories of defects for which damages are recoverable: • Defects in design, workmanship and materials • Landslide and earth settlement problems
Faulty drainage Improper landscaping and irrigation Improper materials Structural failure or collapse Defective plumbing Faulty electrical wiring Inadequate environmental controls Defective lighting or security Insufficient insulation Poor sound protection Examples of Design Defects
Expansive soils Underground water or streams Ancient land slides Vertical settlement Horizontal movement Land sliding Surface failures Improper compaction Inadequate grading and drainage Landslide Problems
Completed Operations Data • ISO Data • Data does not identify construction defects claims • Completed Operations • Looked at latest 5 years (1997 – 2001) • California data is not included
Five Year Experience Ratios Completed Operations • Experience Ratio – Amount needed to cover losses only • All states (ex. CA) = 1.46 • Top 5 • Nevada – 7.56 • Oregon – 2.48 • South Carolina – 2.30 • Washington – 2.17 • Arizona – 2.05