0.20
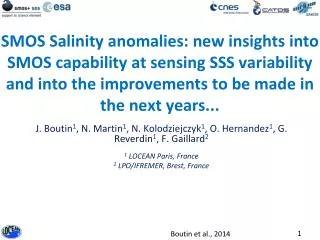
SMOS Salinity anomalies: new insights into SMOS capability at sensing SSS variability and into the improvements to be made in the next years. J. Boutin 1 , N . Martin 1 , N . Kolodziejczyk 1 , O. Hernandez 1 , G. Reverdin 1 , F. Gaillard 2 1 LOCEAN Paris, France

0.20
E N D
Presentation Transcript
SMOS Salinity anomalies: new insights into SMOS capability at sensing SSS variability and into the improvements to be made in the next years... J. Boutin1, N. Martin1, N. Kolodziejczyk1, O. Hernandez1, G. Reverdin1, F. Gaillard2 1 LOCEAN Paris, France 2 LPO/IFREMER, Brest, France
COMPARISON OF SMOS WITH IN SITU SSS RMSDifference (SMOS SSS (1 MONTH or 10 days-100x100KM2) –IN SITU SSS Gulf stream – 10days Reul et al. GRL 2014 Rain Boutin et al 2013 SPURS - Hernandez et al. 2014 After correcting Large scale seasonal Biases 45N 0.5 0.15 0.32 0.3-0.5 <0.2 0.33 0.20 Islands + RFI? Hasson et al. 2014 1 month-200km Durand et al 2013 Amazon Plume 10days - Reul et al. ‘OTT’ Bias corrected region Hasson et al. 2013
SMOS Salinity maps CATDS CEC LOCEAN: ESA level 2 SSS (reprocessing version 5) mapped at monthly & 0.25° spatial resolution ; Running average over 100x100km2 July 2010-June 2014 Ascending + Descending passes available on demand on www.catds.fr (CATDS CEC-LOCEAN product)
Optimal Interpolations of in situ SSS WOA 2013 climatology ISAS v6 (see description of In Situ Analysis System in Gaillard et al. 2009) • Optimal interpolation of in situ S (ARGO, TAO...) – smoothing ~300km –~0.5° resolution at the equator • 2005-2014 monthly fields (Myocean product since 2013) • Keep only pixels where PCTVAR<80% (100%=no information from in situ data) • Objectively analyzed climatology of in situ S – 1° resolution • 2005-2012 monthly averaged climatology
SMOS v5 – ISAS SSS (07/10 to 06/14) RFIs current??? Land (<800km)
Interannual anomalies Most of SMOS SSS biases are about systematic from one year to the other => build a SMOS monthly SSS climatology (07/2010-06/2014) SMOS SSS anomalies wrt SMOS 4yr climatology => interannual variability of SMOS SSS Build ISAS SSS monthly climatology (07/2010-06/2014) ISAS SSS anomalies wrt ISAS climatology => interannual variability of ISAS SSS
Interannual anomalies (see Durand et al. Ocean Dynamics 2013 (tropical Indian Ocean and IOD); Hasson et al. JGR 2014 (La Niña in tropical Pacific Ocean)
100km-monthly SMOS SSS wrt ISAS SSS and SMOS wrt ISAS SSSanomalies 0.2 Further than 800km from the continents 0.2
100km-monthly SMOS SSS wrt ISAS SSS and SMOS wrt ISAS SSSanomalies 0.2 When monthly systematic biases are removed, RMSD (SMOS-ISAS) ~0.2 but ISAS is not the truth (it does not sample mesoscale (it is smoothed over ~300km) and it is affected by ARGO undersampling...) – Doing similar exercise with ship SSS averaged over 0.25° in SPURS region, we found 0.15 (Hernandez et al. 2014)! Further than 1200km from the continents 0.2 0.2
Monthly climatologies differences:ISAS (2005-2012)– WOA2013 (2005-2012) Rmsd: 45S-45N: 0.22 30S-30N: 0.25 Climatologies built from in situ measurements with different optimal interpolation methods are quite different, RMSD (ISAS-WOA) ~0.2 , similar order of magnitude as RMSD (SMOS-ISAS) when systematic biases are removed.... 0.25° resolution
Annual climatologies differences WOA-ISAS 2005-2012 SMOS-ISAS 2010-2014 0.25° resolution
Summary & perspectives SMOS SSS version 5 experiences large systematic biases (latitudinal/seasonal, vicinity of continents, RFIs) ; when considering 4-year anomalies, RMSE(SMOS_SSSa-ISAS_SSSa) ~0.2: this RMSD represents SMOS SSS uncertainties + ISAS SSS uncertainties When doing similar exercise using TSG SSS 0.25° in the subtropical Atlantic, RMSE (SMOS_SSS-ship_SSS)~0.15 => New satellite SSS provide a spatial bi-dimensional information about SSS variability at scales ~100km not accessible by other in situ network SMOS SSS version 6 will have less latitudinal biases and RFIs pollution will be better sorted out but biases in the vicinity (<~800km) of continents will remain – land correction still under study => RMSD SSS (SMOS-ISAS) will remain high due to continent pollution but what about RMSD SSSanomalies???? Next QWGs!