Download
1 / 31
320 likes | 468 Vues
This presentation synthesizes critical epidemiologic data regarding low-dose cancer risks derived from significant studies, particularly in the context of low and fractionated radiation exposures. With over 25 million patients undergoing CT exams in the U.S. in 2007, understanding cumulative effective doses is crucial. The data illustrates linear and non-linear dose-response relationships, emphasizing the necessity for large sample sizes in low-dose research to mitigate statistical power issues. We also discuss variations in radiation sensitivity and implications for certain demographic subgroups.

E N D
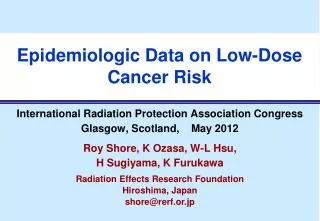
Epidemiologic Data on Low-Dose Cancer Risk International Radiation Protection Association Congress Glasgow, Scotland, May 2012 Roy Shore, K Ozasa, W-L Hsu, H Sugiyama, K Furukawa Radiation Effects Research Foundation Hiroshima, Japan shore@rerf.or.jp
Low, but Significant, Exposures Have Become Very Common About 25 million patients in the US received CT exams in 2007 Sodickson study – large representative sample of 31,000 U.S. patients receiving CT exams in 2007 The distribution of cumulative effective doses from CT over the past 20 years showed: 15% (~3.8 million) with ≥ 100 mSv 4% (~1 million) with ≥ 250 mSv (Sodickson et al, Radiol, 251:175, 2009) 2
Are the excess risks of cancer at low doses proportional to those seen at high doses?– i.e., Is there dose-response linearity? higher/lower than linear risk at low doses? or a dose threshold? 3 3 3
Bone marrow weighted absorbed dose (Gy) A-bomb Leukemia Dose Response Fitted linear-quadratic dose response at age 70 following exposure at age 30 Smoothed non-parametric dose response Dose-effect Threshold: 80 mGy (95% CI: 30, 190 mGy) 4 (Hsu et al, Submitted, 2011)
(LSS Incidence, 1958-1998) 150 100 % Excess Relative Risk 50 Fitted linear dose response at age 70 following exposure at age 30 Smoothed non-parametric dose response 0 0 1 2 3 DS02 Colon Weighted Absorbed Dose (Gy) A-bomb dose response: Solid-cancer incidence • No evidence of non-linearity in the dose response • Significant dose response on 0-150 mGy • Low dose-range slope consistent with full range ERR/Gy= 47% (95%CI: 40-54%) Dose-threshold: 40 mGy (CI: <0, 85 mGy) (Preston et al: Radiat Res 168:1-64, 2007)
Do certain subgroups have greater risk of cancer from radiation exposure? 6 6
Variations in Radiation Sensitivity and Shape of the Dose Response (Hypothetical Data) 7
50 Age at exposure 45 10 20 30 40 35 40 30 Excess Deaths per 10,000 PY-Gy 25 20 15 10 5 0 20 30 40 50 60 70 80 90 Excess Rates of Solid Cancer Mortality by Age at Exposure and Attained Age, A-bomb Attained Age 8 8 (Adapted from: Ozasa et al, Radiat Res, 177:229, 2012)
Sample Size Needed to Study Various Doses, Lifetime Risk (Brenner et al, PNAS 100:13762, 2003)
Special Problems for a Low-Dose Studywith Low Statistical Power Low statistical power—null result is very likely. If the “true” effect is very small, not much more than ~5% of the time will the a risk estimate be “positive” (i.e., statistically significant), so false negative results will be common.Corollaries: The risk estimates for highlighted positive results are likely to be biased upward (Land, Science, 1980) The impact of unmeasured confounding variables is often greater in a low-dose study, because the magnitude of confounding may approach or exceed the magnitude of the dose effect. Confounder bias can be in either direction, i.e., the uncorrected risk estimate can either exaggerate or mask the true degree of association. However, possible confounder variable must be correlated with both exposure and the health outcome to be a confounder.
What do the epidemiologic data show regarding risk from low, fractionated or protracted exposures? 12 12
Data from the Largest Studies of Solid-Cancer and Leukemia Risk To avoid choosing only a small selection of studies that support a particular (positive or negative) viewpoint, an essentially unbiased inclusion method was chosen:To assemble all the studies that met a chosen criterion of number of study cancers. Criteria: ≥400 solid cancers ≥30 leukemias
Expectations for the Tabulation of Studies with Low, Protracted or Fractionated Exposures Publication bias? Nearly all major cohort studies publish results for total solid cancers and leukemia Most large case-control studies also are published To the degree there is an association, substantially more than 5% will be positive (i.e., statistically significant)
Minimum Requirements for Study Inclusion Must have a risk estimate and have low, highly fractionated or protracted exposures Preferable that the risk estimate be based on the dose-response and that the risk per unit dose be reported However, to reduce study selection bias, studies also were included even if they: lacked a dose-response based estimate, were studies reporting only Standardized Incidence or Mortality Ratios (SIR or SMR), were case-control studies (odds ratios)
All Solid Cancers:Summary results of the largest studies (≥400 cancer cases) with low, fractionated or protracted exposures 16 16
Total Solid Cancers after Low, Protracted or Fractionated Exposures: Statistically Significant (“Positive”) Associations Mean Dose (mSv) No. of Cancers RR at 1 Sv(95% CI) Study Japanese A-bomb incidence (Preston ‘07) 230 17,448 1.47 (1.40-1.54) UK nuclear workers (Muirhead ’09) 25 10,855 1.3 (1.04-1.5) Techa River residents (Eidemuller ’10) 30 2064 1.9 (1.4, 2.5) Mayak workers (Shilnikova ’03) 810 1062 1.08 (1.03-1.14) Chinese medical x-ray workers (Wang ’02) ~240 836 1.8 (~1.5-2.1) 131I for hyperthyroidism (Holm ’91) ~60 789 3.0 (1.7-4.4) A Semipalatinsk fallout (Bauer ’05) 634 532 1.8 (1.5-2.3) A Based on Standardized Incidence Ratio (SIR) 17
Total Solid Cancers after Low, Protracted or Fractionated Exposures:Null (“Negative”) Results Study Mean Dose (mSv) No. of Cancers RR at 1 Sv(95% CI) 15-country worker study (Cardis ’07) 19.4 5024 1.6 (0.9-2.4)A Diagnostic 131I (Holm ’91) C ~8 3746 1.01 (0.98-1.04)B Hanford workers (Wing ’05) C 27.9 2265 1.3 (0.7-2.0) French nuclear workers (Metz-Flamant ’11) 21.5 2035 1.5 (0.5-2.5) 131I for hyperthyroidism (Ron ’98) ~40 1597 1.0 (1.0-1.1)B Chernobyl clean-up workers (Ivanov ’07) 215 1370 1.3 (0.6-2.2) High-background area, Kerala (Nair ’09) 161 1349 0.9 (0.4-1.5) Canadian medical workers (Zielinski ’09) 3.8 1205 0.8 (0.7-0.8)B High-background area, China (Tao ’12) 63 941 4.0 (<0.1-49) Rocketdyne workers (Boice ’11) 13.5 651 0.8 (0.3-2.7) Multiple fluoroscopic exams (Davis ’89) ~250 429 0.4 (0.3-0.7) 18 A Excluding Canada due to dosimetry problem. B SIR or SMR value presented, not RR at 1 Sv. C Total cancers.
DDREF: Crude Meta-Analysis for Solid Cancers * Based on the 15 studies with estimated mean doses >10 mSv 19
Leukemia:Summary results of the largest studies (≥30 leukemia cases) with low, protracted or fractionated exposures 20 20
Statistically Significant Leukemia Studies:Environmental or OccupationalProtracted/Fractionated or Low-Dose Radiation Exposure Mean Dose(mGy) No. of Leukemias RR at 1 Gy(95% CI) Japanese A-bomb mortality (Ozasa ’12) 230 318 5.3 (4.1-6.8) Chernobyl fallout regions (Davis ’06) ~6.3 421 33 (10-85) UK nuclear workers (Muirhead ’09) 24.9 234 2.8 (1.2-5.4) Techa River cohort (Krestinina ’10) 300 70 5.9 (2.6-15) Mayak workers (Shilnikova ’03) 810 66 2.0 (1.5-3.1) Savannah River workers (Richardson ’07) 43.7 62 8.7 (2.4-21) Chinese medical x-ray workers (Wang ’02) 244 44 5.8 (2.1-12) US radiologists (Matanoski ’87) ~3000 33 1.7 (1.2-2.3)A A SMR, not at 1 Gy. 21
Nonsignificant Leukemia Studies: Protracted/FractionatedOccupational or EnvironmentalRadiation Exposure
Statistically Significant Leukemia Studies: Low-Dose or Protracted/FractionatedMedicalRadiation Exposure Mean Dose(mGy) or [subgroup] No. of Leukemias Relative Risk: RR (95% CI) Dx x-ray, childhood ALL (Infante-Rivard ’03) [≥2 x-rays] 701 1.5 (1.1-2.0)A Diagnostic 131I (Holm ’89) ~8 119 1.3 (1.1-1.6)B Diagnostic x-ray (Gibson ’72) [≥20 x-rays] 69 1.5 (1.0-2.4)A Diagnostic x-ray (Preston-Martin ’89) [>20 mGy] 55 2.4 (1.1-5.1)A Arthrosis/Spondylitis RT (Damber ’95) [>500 mGy] 41 1.5 (1.1-2.0)B 226Ra for uterine bleeding (Inskip ’90) ~650 34 2.9 (1.8-4.2)C A Odds ratio, not at 1 Gy. B SMR or SIR, not at 1 Gy. C RR at 1 Gy. 23
Statistically Nonsignificant Leukemia Studies, Low-Dose or Protracted/Fractionated MedicalRadiation Exposure Mean Dose(mGy) or [subgroup] # Leukem-ias Relative Risk:RR (95% CI) Dx x-ray & childhood ALL (Shu ’02) [≥3 x-rays] 1842 1.2 (1.0-1.6)A Dx x-ray & childhood leukemia (Meinert ’99) [≥4 x-rays] 1145 1.0 (0.7-1.6)A Dx x-ray & adult AML (Pogoda ’11) [>20 mGy] 412 1.6 (0.8-3.2)A Dx x-ray & adult leukemia (Boice ’91) ? 316 1.4 (0.9-2.2)A Dx x-ray & adult leukemia (Yuasa ’97) ? 247 0.8 (0.5-1.2)A 131I for hyperthyroidism (Ron ’96) 42 82 <1 B 131I for hyperthyroidism (Holm ’91) ~60 34 0.9 (0.4-1.5)B A Odds ratio, not at 1 Gy. B SMR or SIR, not at 1 Gy.
Summary A-bomb data show upward curvature for leukemia but little or none for solid cancers, and suggest risk at quite low doses. Variations in radiation-cancer susceptibility might partly account for approximate dose-response linearity. Certain methodological problems can be exacerbated for low-dose studies. Sought to have broad, unbiased look at magnitude of risk after low, fractionated or protracted (LFP) exposures Found evidence of solid cancer risk from LFP exposures. But too much heterogeneity to have good estimate of DDREF. Clear evidence of leukemia risk after LFP exposures, but can’t quantify 25
Life Span Study (LSS) Cohort (120,321 people) <5mGy 100-500mGy ≥ 2Gy 5-100mGy 38,536 29,976 Proportion (%) 26,580 12,341 7,070 3,428 1,765 625 27 DS02 Colon Weighted Absorbed Dose (Gy)
“Expected” Dose-Response Slopesfor Truncated Dose Ranges 2 0.4 0.04 Hypothetical Dose-Response Slopes Excess Relative Risk/Gy Dose Range Examined (Gy) 28
3.5 3.0 2.5 2.0 1.5 1.0 0.5 Full range LSS Mortality Estimates of Relative Risk at 1 Gy for Various Dose Ranges (0 to Plotted Dose) RR at 1 Gy Colon weighted absorbed dose (Gy) (Ozasa et al, Radiat Res, 177:229-43, 2012) 29 29
Special Problems for Individual Low-Dose Studies with Low Statistical Power Low statistical power—null result is very likely. If the “true” effect is very small, not much more than ~5% of the time will the a risk estimate be “positive” (i.e., statistically significant), so false negative results will be common.Corollaries: With low statistical power some of the “positive” results will be false-positive results The risk estimates for selected positive results are likely to be biased upward (Land, Science, 1980) The impact of unmeasured confounding variables is often greater in a low-dose study, because the magnitude of confounding may approach or exceed the magnitude of the dose effect. Confounder bias can be in either direction, i.e., the uncorrected risk estimate can either exaggerate or mask the true degree of association
200 150 100 50 0 % ERR at 1 Gy 0 10 20 30 40 Cigarettes per day Radiation Risk for Lung Cancerby Smoking Frequency, A-bomb *Gender-averaged excess risk relative to unexposed person with same smoking history (Adapted from: Furukawa et al, Radiat Res, 174:72-82, 2010)