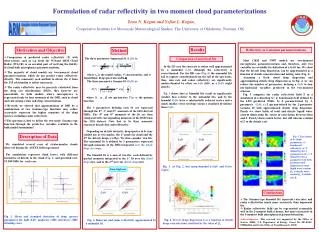
RADAR INTER-COMPARISON AS A REFLECTIVITY CALIBRATION CHECK
310 likes | 507 Vues
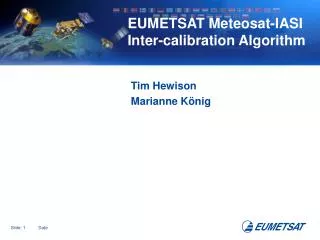
RADAR INTER-COMPARISON AS A REFLECTIVITY CALIBRATION CHECK. RADAR MONITORING WORKSHOP ERAD 2010 SIBIU ROMANIA Mike Dixon National Center for Atmospheric Research Boulder, Colorado. Inter-radar calibration for radar networks.

RADAR INTER-COMPARISON AS A REFLECTIVITY CALIBRATION CHECK
E N D
Presentation Transcript
RADAR INTER-COMPARISON AS AREFLECTIVITY CALIBRATION CHECK RADAR MONITORING WORKSHOPERAD 2010 SIBIU ROMANIA Mike Dixon National Center for Atmospheric ResearchBoulder, Colorado
Inter-radar calibration for radar networks • For effective use of weather radar data, especially reflectivity, it is important that the radars be accurately calibrated. • In radar networks, when the radar coverage from adjacent radars overlaps, it is possible to perform an inter-comparison between the radars, to identify mismatches in the reflectivity values. • This technique can be helpful in identifying calibration errors.
Radars from BOM, Australia • As an example, we use data from 3 radars belonging to the Australian Bureau of Meteorology. • The area of interest is Brisbane, Queensland, Australia. • The radar characteristics are: • CP2, S-band, dual-polarization Doppler, 0.92 degree beam width • Mt Stapleton, S-band, single-polarization Doppler, 1.0 degree beam width • Marburg, S-band, non-Doppler, 2.0 degree beam width
Radar locations south of BrisbaneRange rings are from CP2, in 50 km intervals The spacing between the radars is approximately 35 km
Zoomed view of radar locations The green rectangle delineates the area to be used for comparison
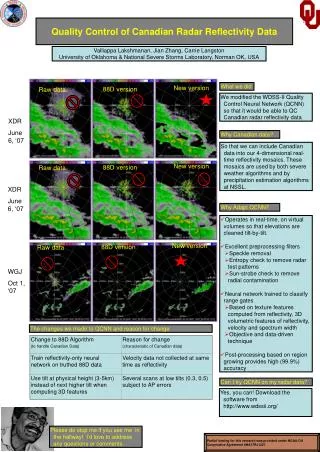
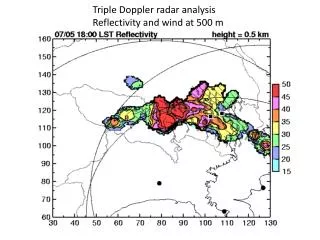
Comparison case2008/11/16, 06:30 to 08:30 UTC • For the comparison, we use data from a squall line which moved through the Brisbane area on 2008/11/16. • The period of interest is 06:30 UTC to 08:30 UTC, which is 15:30 to 17:30 local time. • The squall line produced heavy precipitation and large hail in the Brisbane metropolitan area.
Reflectivity plots from each radar • The following 3 slides show PPI reflectivity plots for CP2, Mt Stapleton and Marburg, respectively, at 08:15 UTC. • The 3 slides after that show a vertical section from each of the radars, for a line from CP2 to the north. The location of the vertical sections can be seen on the PPIs, from the point marked ‘1’ to the point marked ‘2’.
Mt Stapleton reflectivity,Vertical section to the North, 08:15 UTC
Marburg reflectivity,Vertical section to the North, 08:15 UTC
Inter-comparison method • We compare the radars in pairs, as follows: • CP2 (polar) vs. Mt Stapleton (polar), comparing the max reflectivity at any level above 2 degrees. • CP2 (polar) vs. Marburg (Cartesian), comparing the max reflectivity at any level above 2 degrees for polar and 2 km for Cartesian. • Mt Stapleton (Cartesian) vs. Marburg (Cartesian), comparing values at each available CAPPI height. • CP2 has only polar data, Marburg has only Cartesian data, and Mt. Stapleton has both. • We perform the comparison in this way to show that it is reasonably robust, and can handle varying geometry.
Inter-comparison method • We accumulate data for all available times between 06:30 and 08:30 UTC. • For each of the radar pairs, we identify scans which are close enough in time for a reasonable comparison – i.e. within 5 minutes of each other. • We compute the difference in reflectivity between each pair, for each grid point. We discard differences with an absolute value greater than 15 dB. • We perform the comparison within the bounding box shown earlier, and repeated on the next slide.
Bounding box for inter-comparison The green rectangle delineates the area to be used for comparison
Inter-comparison results • The following plots show the results of the pair-wise inter-comparisons. • There are 2 plot types: • 2-D histograms, showing the reflectivity for one radar plotted against the other; • 1-D histograms, shows the distribution of the differences between the reflectivity values at each radar.
2-D histogram of CP2 vs. Mt Stapleton The magenta line is the 1:1 line. The 2 radars are similarly calibrated.
2-D histogram of CP2 vs. Marburg The magenta line is the 1:1 line. CP2 has higher values than Marburg.
2-D histogram of Mt Stapleton vs. Marburg The magenta line is the 1:1 line. Mt Stapleton has higher values than Marburg.
1-D histogram of CP2 minus Mt Stapleton The 2 radars are similarly calibrated.
1-D histogram of CP2 minus Marburg CP2 has higher values than Marburg.
1-D histogram of Mt Stapleton minus Marburg Mt Stapleton has higher values than Marburg.
Conclusions • These results show that CP2 and Mt Stapleton are, for practical purposes, calibrated identically, while Marburg is about 4.8 dB lower. • It seems likely that Marburg is mis-calibrated, although this could be a combination of low calibration for Marburg and a high calibration for the other two. • NOTE: although this result shows agreement between the 3 comparison pairs, this is not always the case. The technique must be repeated for a number of weather events, to ensure an accurate result.