
Chapter 3 Data Modeling Using the Entity-Relationship Model
E N D
Presentation Transcript
Chapter 3Data Modeling Using the Entity-Relationship Model • High-level conceptual model • Used for the conceptual design of DB applications • Many DB design tools employs its concepts • Chen 1976 -- MIT • “The Entity-Relationship Model -- Toward a Unified View of Data” ACM - TODS
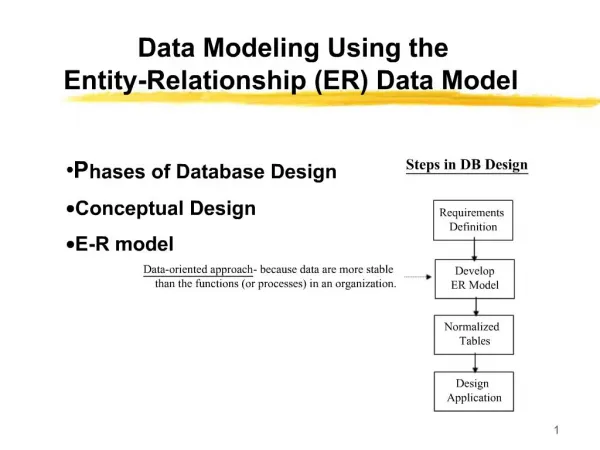
Overview of Database Design Process • Two main activities: • Database design • Applications design • Focus in this chapter on database design • To design the conceptual schema for a database application • Applications design focuses on the programs and interfaces that access the database • Generally considered part of software engineering
Entities, Attributes • Entity - a ”thing” in the real world with independent existence • Attribute - properties that describe the entity • Simple (atomic) vs. composite • Single-values vs. multivalued • Stored vs. derived • Null values • Complex Attributes {AddressPhone({Phone(areacode,phonenumber)}, Address(StreetAddress(Number,Street,AptNumber),City,State,Zip))}
Entity Types, Entity Set, Keys, and Value Sets • Entity Types: Defines a collection (or set) of entities that have the same attributes e.g. employee, student • Entity Set: The collections of all entities of a particular entity type e.g. employee = set of all employees • Value Sets: specifies the set of values assigned to attribute (domain of values)
Dependencies • 1) Existence Dependency • X and Y are entities • Y entity cannot exist without X entity • Y cannot enter the database unless its corresponding X is there • if X is dropped from the database, Y must be dropped as well • X = strong, parent, owner, dominant • Y = weak, child, dependent, subordinate
Weak Entity Types • An entity that does not have a key attribute • A weak entity must participate in an identifying relationship type with an owner or identifying entity type • Entities are identified by the combination of: • A partial key of the weak entity type • The particular entity they are related to in the identifying entity type • Example: • A DEPENDENT entity is identified by the dependent’s first name, and the specific EMPLOYEE with whom the dependent is related • Name of DEPENDENT is the partial key • DEPENDENT is a weak entity type • EMPLOYEE is its identifying entity type via the identifying • relationship type DEPENDENT_OF
2) Identifier Dependency • Occurs when the weak entity set does nothave a candidate key, and its instances are indistinguishable w/o a relationship with other entity (e.g. grade). • 3) Referential Dependency • Occurs when a weak entity contains a foreign key of the corresponding strong entity (e.g. essn in Dependent table) • Referential Constraint • A nonnull value of the foreign key attribute in the entity instance must always equal the value of the primary key of an associated strong entity instance.
Displaying a recursive relationship • In a recursive relationship type. • Both participations are same entity type in different roles. • For example, SUPERVISION relationships between EMPLOYEE (in role of supervisor or boss) and (another) EMPLOYEE (in role of subordinate or worker). • In following figure, first role participation labeled with 1 and second role participation labeled with 2. • In ER diagram, need to display role names to distinguish participations.
Recursive Relationship Type is: SUPERVISION(participation role names are shown)
Notation for Constraints on Relationships • Cardinality ratio (of a binary relationship): 1:1, 1:N, N:1, or M:N • Shown by placing appropriate numbers on the relationship edges. • Participation constraint (on each participating entity type): total (called existence dependency) or partial. • Total shown by double line, partial by single line. • NOTE: These are easy to specify for Binary Relationship Types.
Alternative (min, max) notation for relationship structural constraints: • Specified on each participation of an entity type E in a relationship type R • Specifies that each entity e in E participates in at least min and at most max relationship instances in R • Default(no constraint): min=0, max=n (signifying no limit) • Must have minmax, min0, max 1 • Derived from the knowledge of mini-world constraints • Examples: • A department has exactly one manager and an employee can manage at most one department. • Specify (0,1) for participation of EMPLOYEE in MANAGES • Specify (1,1) for participation of DEPARTMENT in MANAGES • An employee can work for exactly one department but a department can have any number of employees. • Specify (1,1) for participation of EMPLOYEE in WORKS_FOR • Specify (0,n) for participation of DEPARTMENT in WORKS_FOR
The (min,max) notation for relationship constraints Read the min,max numbers next to the entity type and looking away from the entity type
Alternative diagrammatic notation • ER diagrams is one popular example for displaying database schemas • Many other notations exist in the literature and in various database design and modeling tools • Appendix A illustrates some of the alternative notations that have been used • Unified Modeling Language (UML) class diagrams is representative of another way of displaying ER concepts that is used in several commercial design tools
Unified Modeling Language (UML) class diagrams • Represent classes (similar to entity types) as large rounded boxes with three sections: • Top section includes entity type (class) name • Second section includes attributes • Third section includes class operations (operations are not in basic ER model) • Relationships (called associations) represented as lines connecting the classes • Other UML terminology also differs from ER terminology • Used in database design and object-oriented software design • UML has many other types of diagrams for software design (see Chapter 12)
Relationships of Higher Degree • Relationship types of degree 2 are called binary • Relationship types of degree 3 are called ternary and of degree n are called n-ary • In general, an n-ary relationship is not equivalent to n binary relationships • Constraints are harder to specify for higher-degree relationships (n > 2) than for binary relationships
Discussion of n-ary relationships (n > 2) • In general, 3 binary relationships can represent different information than a single ternary relationship (see Figure 3.17a and b on next slide) • If needed, the binary and n-ary relationships can all be included in the schema design (see Figure 3.17a and b, where all relationships convey different meanings) • In some cases, a ternary relationship can be represented as a weak entity if the data model allows a weak entity type to have multiple identifying relationships (and hence multiple owner entity types) (see Figure 3.17c)
Discussion of n-ary relationships (n > 2) • If a particular binary relationship can be derived from a higher-degree relationship at all times, then it is redundant • For example, the TAUGHT_DURING binary relationship in Figure 3.18 (see next slide) can be derived from the ternary relationship OFFERS (based on the meaning of the relationships)
Displaying constraints on higher-degree relationships • The (min, max) constraints can be displayed on the edges – however, they do not fully describe the constraints • Displaying a 1, M, or N indicates additional constraints • An M or N indicates no constraint • A 1 indicates that an entity can participate in at most one relationship instance that has a particular combination of the other participating entities • In general, both (min, max) and 1, M, or N are needed to describe fully the constraints
Data Modeling Tools • A number of popular tools that cover conceptual modeling and mapping into relational schema design. • Examples: ERWin, S- Designer (Enterprise Application Suite), ER- Studio, etc. • POSITIVES: • Serves as documentation of application requirements, easy user interface - mostly graphics editor support • NEGATIVES: • Most tools lack a proper distinct notation for relationships with relationship attributes • Mostly represent a relational design in a diagrammatic form rather than a conceptual ER-based design (See Chapter 12 for details)
Some of the Currently Available Automated Database Design Tools
Extended Entity-Relationship (EER) Model (in next chapter) • The entity relationship model in its original form did not support the specialization and generalization abstractions • Next chapter illustrates how the ER model can be extended with • Type-subtype and set-subset relationships • Specialization/Generalization Hierarchies • Notation to display them in EER diagrams
Chapter Summary • ER Model Concepts: Entities, attributes, relationships • Constraints in the ER model • Using ER in step-by-step conceptual schema design for the COMPANY database • ER Diagrams - Notation • Alternative Notations – UML class diagrams, others
Mapping an E-R Model to a Relational Model • 1) The entity sets represented by rectangles becomes relations represented by tables • 2) For strong entity sets, attributes represented by ovals become attributes of the relations or column headings of the table • For weak entity set - all attributes include all the attributes of the weak entity, plus the primary key of the owner entity • 3) The table for a relationship set has column headings consisting of the associated entities, plus column for descriptive attributes if any
Exercise: create ER-Diagrams a) COURSE(COURSE#,C_TITLE,INS_NAME,TEXT_BOOK,PUBLISHER) b) ENROLLMENT(STUID,COURSE#,STUNAME,COURSETITLE, GRADE) c) PART(PART#,PART_NAME,DEPARTMENT,PRICE) d) EMPLOYEE(EMPID,EMPNAME,DATE_HIRED,JOB_TITLE, JOB_LEVEL, PROJ#, PROJ_TITLE,DUEDATE,HOURS_WORKED) e) BOOK(ISBN,TITLE,AUTHOR,AUTHOR_INSTITUTE,PRICE, PUBLISHER_NAME, PUBLISHER_ADR) f) CUSTOMER(CUSTID,CUSTNAME, PHONE#, STREET,CITY,STATE,ZIP)
Examples • http://www.meds-sdmm.dfo-mpo.gc.ca/meds/Prog_Nat/NCIS/Definition/Ncis_ER_diagram.gif
Data Modeling Tools - Visio 2007 • Visio 2007 Demo: Show It Like It Is -- Connect Data to Your Visio DiagramThis demo shows how you can use Microsoft Office Visio Professional 2007 to analyze how a process or other area is actually performing by connecting data to the shapes in your diagram. 1/30/2008Visio 2007 Demo: Create a background and watermark for your drawingsLearn how to create a background and watermark for your drawings in Microsoft Office Visio 2007. 1/25/2008Visio 2007 Demo: Let Data Tell Its Story with Data GraphicsIn this demo, you’ll see how to use data graphics in your Microsoft Office Visio 2007 diagram to present the right data in the right way and to make your points clearly. 1/30/2008 • Visio 2007 Demo: Give Your Diagram a Makeover by Applying a ThemeUse themes in Microsoft Office Visio Professional 2007 to easily add color and style to your diagram and create an attractive, engaging piece. 1/30/2008Visio 2007 Demo: Get a New Perspective on Data with PivotDiagramsIn this demo, you’ll see how PivotDiagrams can help you get a fresh perspective on your data.
Oracle Designer – Oracle Designer • http://www.oracle.com/technology/products/designer/demos.htm Database Design and Generation • Creating Entity Diagrams (Viewlet) • Creating Database Designs (Viewlet) • Working With Server Models (Viewlet) • Generating Databases (Viewlet) • Capturing Database Designs (Viewlet)
Data Modeling Tools Sybase – PowerDesigner • http://www.sybase.com/products/modelingmetadata/powerdesigner/demonstrationvideos • http://www.datamodel.org/PowerDesigner/ Database Designers the technical video demonstrates: • A Walk Through of a Sample Conceptual Data Model • Reverse Engineer a PDM from a Database • Iterative Bi-level Design with PowerDesigner • Keeping the Modeling and the Servers Synchronized • Download this video:http://download.sybase.com/presentation/pdvideo/pd_dba1.exe