Download
1 / 53
600 likes | 1.11k Vues
The Theory of Constraints. The Theory of Constraints. Eli Goldratt, a physicist. OPT: a scheduling package. The Goal and the Theory of Constraints. Goldratt challenges the conventional approach to managing organizations. Traditional Decision Making.

E N D
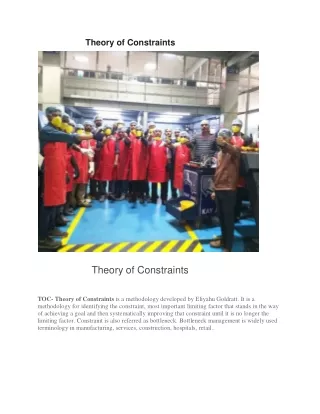
The Theory of Constraints • Eli Goldratt, a physicist. • OPT: a scheduling package. • The Goal and the Theory of Constraints. • Goldratt challenges the conventional approach to managing organizations.
Traditional Decision Making • How are investment decisions usually made? • “The Cost-World” Perspective • Consider how such a perspective affects the push towards parts per million (PPM) quality and “Zero” inventory.
The Cost World Perspective: Cost and PPM Quality $60,000 $20,000 8% 2% $15,000 $20,000 2% 0.5% $4,000 $20,000 0.5% 0.1%
The Cost World Perspective: Cost and Inventory Turns * Assuming starting inventory of $15M and 25% carrying cost
The Real Cost of Inventory • Inventory adversely affects all the factors that give you a competitive edge (Price, Quality, and Delivery). It results in • Increased costs due to obsolescence, storage costs, overtime, etc., • Defects not being detected soon enough, • Longer lead times and poorer delivery performance.
Assume the following data Raw Material cost per unit: $10 WIP value per unit: $20 Finished Goods value per unit: $35 Sale Price per unit: $50 Other Operating Expenses: $4 Million in 1996; $3.75 Million in 1997 1996 1997 Beginning WIP Inventory (1000 units) 50 50 Beginning FG Inventory (1000 units) 40 40 Raw Material (1000 units) 400 330 Sales (1000 units) 400 400 Ending WIP Inventory (1000 units) 50 10 Ending FG Inventory (1000 units) 40 10
The Income Statement 1996 1997 Sales (1000 $) Beginning WIP Inventory (1000 $) Beginning FG Inventory (1000 $) Raw Material Purchase (1000 $) Other Expenses (1000 $) Ending WIP Inventory (1000 $) Ending FG Inventory (1000 $) Cost of Goods Sold (1000 $) Profit (1000 $) 20,000 20,000 1,000 1,000 1,400 1,400
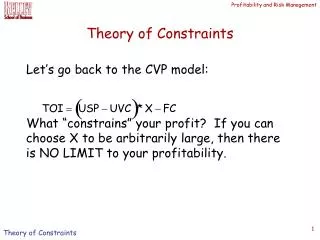
Product Costs • How do we calculate a company’s profit? Net Profit = Sp Revenuep - Sc Expensec. • Note: first summation is on product types, second summation is on categories. • So, how can we use this information to, say, decide on launching a new product?
Product Costs • Allocate! If we can allocate costs correctly: • How to determine product cost accurately? • Standard Costs: • Activity Based Costing (ABC) • Net Profit = Sp Revenuep - Sp Expensep • = Sp (Revenuep - Expensep)
Product Costs At National Pumps • National Pumps, Inc. has obtained the standard cost for one of its pumps: Direct Material $500 Direct Labor $100 Overhead Allocation $400 Standard Cost $1,000 • This pump sells in the US for $1,250. • Plant is currently running at 80% capacity
Product Costs At National Pumps • There is a big demand for this pump in the Asian market. • Should National Pump cut its selling price to penetrate the Asian market? • If so, by how much should it discount its price?
The Theory of Constraints • The Theory of Constraints (TOC) is based on two premises: • The Goal of a business is to make more money, … in the present and in the future. • A system’s constraint(s) determine its output.
Types of Constraints • Physical Constraints • Physical, tangible; easy to recognize as constraint. Machine capacity, material availability, space availability, etc. • Market Constraints • Demand for company’s products and services is less than capacity of organization, or not in desired proportion. • Policy Constraints • Not physical in nature. Includes entire system of measures and methods and even mindset that governs the strategic and tactical decisions of the company.
Policy Constraints • Mindset Constraints • A constraint if thought process or culture of the organization blocks design & implementation of measures & methods required to achieve goals. • Measures Constraints • A constraint if they drive behaviors that are incongruous with organizational goals. • Methods Constraints • A constraint when procedures and techniques used result in actions incompatible with goals.
Local Performance Measures:The Sales Department • A 1% sales commission: 2 products: • Cadillacs: $40,000 • Beetles: $20,000 • Which product will the sales person push? • Suppose the profit margins are • Cadillac: $1,500 • Beetle: $2,500 • Which product will the CEO want you to push? Conflicting goals (local and global).
TOC and Systems Thinking • TOC promotes “Systems Thinking”: global optimization (not localoptimization). • The performance measures advocated by TOC are global measures.
The Theory of Constraints • The Theory of Constraints (TOC) is based on two premises: • The Goal of a business is to make more money, … in the present and in the future. • A system’s constraint(s) determine its output.
TOC Performance Measures • Throughput (T): The rate at which the system generates money through sales. • Inventory (I): All the money invested in purchasing things needed by the system to sell its products. • Operating Expenses (OE): All the money the system spends, turning inventory into throughput.
Return on = Net Profit = ( T - OE ) / I Investment inventory • Inventory = throughput Turns inventory Relating TOC Measures to Traditional Measures • T = Sale Price - Direct Material Cost • OE = Direct Labor Cost + Overhead • Net Profit = T - OE
The Throughput World: The Five Step Focusing Process of TOC • Step 1: Identify the System’s Constraint(s) • Step 2: Decide how to Exploit the System’s Constraints • Step 3: Subordinate Everything Else to that Decision • Step 4: Elevate the System’s Constraints • Step 5: If a Constraint Was Broken in Previous Steps, Go to Step 1
Identifying Constraints • Identifying Physical Constraints: • A Typical WIP Inventory Profile: Ave. WIP Inventory R1 R2 R3 R4 R5 R6
How can we get the most from Physical Constraints? • Techniques for optimizing capacity constraints: • Eliminate periods of idle time • Reduce setup time and run time per unit • Improve quality control • Reduce the workload • Purchase additional capacity • Is there anything else we can do?
An Example:A Plant Producing Two Products $90 / unit $100 / unit Q: P: 100 units / week 50 units / week D D Purchased Part 15 min. 5 min. $5 / unit C B C 10 min. 5 min. 15 min. B A A 15 min. 15 min. 10 min. RM1 RM2 RM3 $20 per $20 per $20 per unit unit unit Time available at each work center: 2,400 minutes per week Operating expenses per week: $6,000 A Production System Manufacturing Two Products, P and Q
Processing Requirements (all times in minutes) Can We Meet The Demand? • Perform a Capacity Analysis • Available time / week on each resource: 2400 min.
Can We Meet The Demand? • Resource requirements for 100 P’s and 50 Q’s are: • Resource A: 100 x + 50 x = minutes • Resource B: 100 x + 50 x = minutes • Resource C: 100 x + 50 x = minutes • Resource D: 100 x + 50 x = minutes
Any Bottlenecks? • B is a bottleneck. • A, C, & D are not bottlenecks. They all have spare capacity at desired production levels.. • We cannot achieve desired levels of production due to the capacity constraint on B. • So, what production levels do we set for P & Q?
The Production Decision • Which product has higher profit margin? • Product P: • Product Q: • Which product requires less effort? • Product P: • Product Q: • So, it looks like is the star and is the “dog.” We will first offer the star to the market. If we still have residual capacity, we will offer the dog. Makes sense, does it not?
What Is The Net Profit? • Consider the bottleneck, B. To produce 50 units of Q we need 50 x = min. on B. • This leaves min. available on B, for producing P. • Each unit of P requires minutes on B. So, we can produce units of P. • If we produce and sell 50 units of Q and units of P each week, we get 50 x $60 + x $45 = $ per week. • When we factor in operating expense ($6,000), we find we
Do We Shut The Plant Down? • Wait! We are not adopting the “throughput world” perspective are we? • We worked with “product profits.” • In the throughput world, there is no such thing as product profit, is there? Only company’s profit. • What is the second focusing step? DECIDE HOW TO EXPLOIT THE CONSTRAINT.
Exploiting The Constraint • Each unit of Q brings $ to the company. • How many minutes of B do we use for one unit of Q? minutes. • So, by promoting Q, we receive $ per constraint minute. • Each unit of P brings $ to the company. • How many minutes of B do we use for one unit of P? minutes. • So, by promoting P, we receive $ per constraint minute.
Throughput World vs Cost World • The throughput world perspective indicates that we should first focus on producing product . • The cost world perspective had indicated that we should first focus on producing product .
Which Perspective Is Correct? • If we focus on P first, we can sell 100 Ps / week, requiring minutes of B. That leaves minutes available on B to produce Q. • Each unit of Q requires minutes on B. So, we can produce units of Q. • By producing 100 units of P and units of Q, we get 100 x $45 + x $60 = $ each week. • After subtracting $6,000 for operating expenses, we obtain a net profit of
Cost World or Throughput World? • So, what product will you focus on?
Shifting Paradigms Current PriorityNew Priority First: OE T Second: T I Distant Third: I OE Cost World Throughput World
Moving to the Throughput World • If you move to the throughput world, you have a competitive advantage, since most of your competitors are still in the cost world. • How do you shift the perspective to the throughput world? • How do you effect the change?
Implementing TOC In The Shop Floor • How do we implement a scheduling technique in the shop floor in line with the 5 focusing steps of TOC? • Recall the fundamental steps: • Identify the constraint • Decide how to exploit it • Drum-Buffer-Rope (DBR) technique.
FINISHED GOODS RAW MATERIAL WORK-IN-PROCESS A Troop Analogy • Spreading troops = high inventory. Closely packed troops = lower inventory. • How can we prevent troops from spreading?
A Troop Analogy • Put the slowest soldiers at the front and the strongest ones in the rear.
A Troop Analogy • In other words, restructure your factory so that the most loaded machines (the capacity constraints) are at the first operations, and place the machines that have a lot of excess capacity downstream.
A Troop Analogy • Put a drummer at the front to set the pace. • Have sergeants constantly urge the soldiers to close any gaps.
A Troop Analogy • That’s common practice now: • The sergeant is the expeditor and the drummer is the material management system assisted by a computer • But can the soldiers follow the drum beat?
A Troop Analogy • “If a worker doesn’t have anything to do, let’s find him something to do.” • As long as this mentally exists, each soldier will proceed according to his potential and not according to the constraints of the troop. • Do efficiencies, incentives and variances allow your workers to follow the drum beat?
FINISHED GOODS RAW MATERIAL A Just-In-Case System • A “push” system. The drum beat is set by the gating operation: it is the rate at which the first machine executes. • Result: • Inventory is high • Current throughput is protected • Future throughput is in danger
A Troop Analogy • Henry Ford: The assembly line. • Taiichi Ohno: Kanban system • Rate of production regulated by Kanbans. Workers are instructed to “Stop work when kanbans are full!”
FINISHED GOODS RAW MATERIAL A Just-In-Time System • The drum is held by marketing demands • Result: • Inventory is low • Current throughput is in danger • Future throughput is increased
Just-In-Time Systems & Kanbans • Work is “synchronized.” • Inventory is low • But any significant disruption will cause the entire system to stop.
A Troop Analogy • Since the weakest soldier dictates pace: • To prevent spreading, tie weakest soldier to the front row. • To protect overall pace, provide some slack in the rope.
FINISHED GOODS RAW MATERIAL Major Capacity Constraint A rope tying the gating operation to the buffer Time Buffer Synchronized Manufacturing The Drum-Buffer-Rope Way
The 5 Focusing Steps (Contd.) • What is Step 4? • Elevate the System’s Constraints • How does it affect us here? • The Marketing Director Speaks Up : • “Another constraint in our company.” • It is the market • A Great Market in Japan! • “Have to discount prices by 20%”