Download
1 / 5
50 likes | 183 Vues
The King George County Schools FY15 budget emphasizes a zero-based approach to non-personnel expenditures, ensuring equitable per pupil funding based on identified needs. The proposed budget projects state revenue at approximately $21.1 million, derived from an Average Daily Membership (ADM) of 4,130 students. Key operational fund increases include employee step raises, a cost-of-living allowance, and funding for special education services. The community is invited to engage in discussions regarding these proposed expenditures and their implications for local schools.

E N D
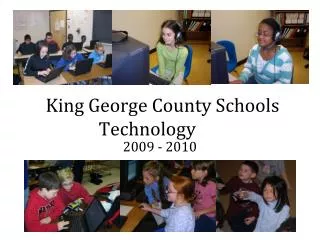
King George County SchoolsBudget Highlights FY15 A Community Conversation
Budget Building Process • We zero base our non-personnel expenditures at the district level • You may access a detailed listing of proposed expenditures via the “budget builder” spreadsheet • We provide “per pupil funding” to support each school as far as their identified consumable needs. Maintaining the same amount per pupil and multiplying by the number of students helps ensureequity across all schools. • We have estimated our state revenue for FY15 using a projected Average Daily Membership (ADM) of 4130 students. • FY13 Budget Built on an ADM of 4100 • Fall 2013 enrollmentreported to the State = 4160 • Split the difference = 4130
Revenue Summary • Revenue projection is based on Average Daily Membership (ADM) of 4130 for the 2014-15 school year. ADM is different than our enrollment at any given time. It is, on average for the year, how many students will be enrolled on any given day. FY14 FY15 Difference • State Revenue $ 19,468,012$ 21,097,451 $ 1,629,439 • Federal Grant 252$ 1,365,672 $ 1,290,786 $ (74,886) • Other Federal Funds $ 190,000 $ 190,000 • State Misc. Revenue $ 30,000 $ 70,000 $ 40,000 • Other Revenue $ 200,000 $ 200,000 • Local Revenue $ 14,349,353 $ 15,218,949 $ 869,596 Total Difference $ 2,464,149
Major Operating Fund Increases for 2014-15At a Glance • Proposed Employee Step Increase $ 535,401 • Proposed Employee Cost of Living Allowance $ 212,757 • VRS “fully funded” increase 2.9% $ 505,486 • VRS year 3 offset 1% $ 264,720 • Capital Outlay/ Student Furniture$ 57,000 • Special Education Increased Services $ 407,481 • New Positions Due to Growth (yearly salary and benefits) • 6 Paraprofessionals (Kindergarten & Special Ed.) $ 100,993 • 5 Teachers (Elementary) $ 238,602 • .5 Counselor (Middle) $ 26,054 • 1 Bus Mechanic $ 50,400
FY14 : FY15Major Areas of Difference • Virginia Retirement System (VRS)$ 770,206 • Year three of the 1% Employee Contribution • “Fully Funded” 2.9% Employer Increase • Personnel - Compensation $ 748,158 • Proposed 1% Cost of Living Allowance • Proposed Employee Step Increase (2%) • Special Education Services $ 407,481 • Services necessary to provide FAPE • Personnel – Additional Positions $ 416,049