Download
1 / 1
10 likes | 125 Vues
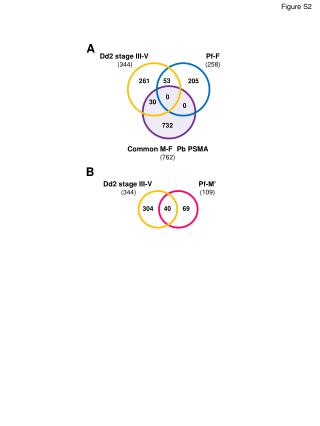
This figure illustrates the intricate comparison between Dd2 stage III-V and Pf-F M-F, highlighting the nuances in their biological behaviors. The study focuses on various parameters including growth rates, metabolic activity, and other critical metrics across different conditions. A detailed examination of these factors provides insight into the underlying mechanisms of these strains. This data is crucial for understanding their implications in therapeutic and diagnostic applications involving PSMA.

E N D
Figure S2 A Dd2 stage III-V (344) Pf-F (258) 0 Common M-F Pb PSMA (762) B Dd2 stage III-V (344) Pf-M’ (109) 304 40 69 53 261 205 0 30 732