Lecture 4--Genetic Data Analysis
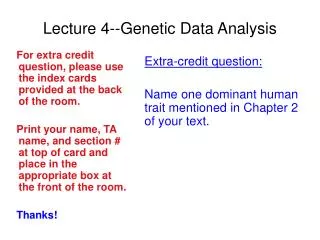
For extra credit question, please use the index cards provided at the back of the room. Print your name, TA name, and section # at top of card and place in the appropriate box at the front of the room. Thanks!. Extra-credit question:

Lecture 4--Genetic Data Analysis
E N D
Presentation Transcript
For extra credit question, please use the index cards provided at the back of the room. Print your name, TA name, and section # at top of card and place in the appropriate box at the front of the room. Thanks! Extra-credit question: Name one dominant human trait mentioned in Chapter 2 of your text. Lecture 4--Genetic Data Analysis
Genetic Data Analysis Does a genetic model fit the data?
Genetic Experiments • You have discovered a new mutation in a fruit fly and have done a set of crosses to determine the inheritance pattern. • What if the F2 generation of a monohybrid cross has a phenotypic ratio of 3.5 to 1? • How do we tell if deviations from an expected result is due to chance or due to the fact that our genetic hypothesis is wrong?
Thought Experiment • Repeat a simple experiment many times. • Toss a fair coin 100 times and count how many heads are thrown. • Repeat this experiment 100 times. What is the most likely outcome of a single experiment (if coin is fair)? Will all 100 experiments have the same outcome?
What is the probability that you would get 55 or more heads in a single experiment? P = 0.184. So, 55 is different from expected, but close enough that the differences is likely due to chance. What is the probability that you would get 65 or more heads? P = 0.0018. So, 65 is different from expected, and the difference is unlikely to be due to chance.
Genetic example • Q: You cross two moths with different phenotypes, then cross the F1 back to the parent that you think has a recessive phenotype (testcross). Progeny: 65 of the “dominant” phenotype, and 35 of the “recessive” phenotype. Can you reject your hypothesis that the F1 individual was Aa and the ‘recessive’ parent was aa? • First, what is the expected result? • What is the observed result? • How could we measure the difference between the expected and observed results?
Genetic Model • P: AA x aa • F1: Aa • Testcross: Aa x aa • Expected result? • (100 offspring) • Observed result? 50 Aa: 50 aa 65 Aa: 35 aa Hypothesis (null): observed results do not deviate from expected results more than expected by chance.
2 Test • A way to tell if the difference between observed results and expected results is too big to be due to chance. • Observed number (O) in each category is compared to the expected number (E) under your genetic model: (Obs - Exp). • Use the square of the difference between observed and expected numbers : (O - E)2 • Standardize by dividing by the expected number in a category: (O - E)2 /E
2 Test = ∑ [(O-E)2]/E = ∑ (d2/E) (O-E) is the “difference” (d). symbol means to sum the values over each category or “class” of the data.
2 Table Probabilities
Experiment • You have crossed two plants with purple flowers. Your hypothesis is that both plants are heterozygous for a dominant allele at a single locus controlling flower color. • H0: P: (Ww X Ww) H0 stands for ‘null hypothesis’ • F1: 3/4 W- (purple) and 1/4 ww (white) • Expected: If H0 is true, you expect 3/4 purple and 1/4 white out of 166: 124.5 purple: 41.5 white. • Observed Data: 166 progeny: 110 purple & 56 white. • Q: Is the deviation from expected too big to be due to chance?
Test • Class O E (O-E) (O-E)2 = d2 d2 /E • Purple • White 124.5 41.5 -14.5 14.5 210.25 210.25 1.69 5.07 110 56 = 6.76 df = 1 Table Probabilities
Problem: An ear of corn has a total of 381 grains, including 216 purple, smooth, 79 purple, shrunken, 65 yellow, smooth, and 21 yellow, shrunken. • Your Hypothesis: This ear of corn was produced by a dihybrid cross (PpSs x PpSs) involving two pairs of heterozygous genes resulting in an expected ratio of 9:3:3:1. Purple dominant to yellow; smooth dominant to shrunken.
d.f. = 3 2 = 1.80 Probabilities
Extra credit problem for next class • An agouti mouse is crossed to a white mouse and all the F1 offspring are agouti. • An F1 female is crossed to an F1 male, and the offspring are: • 11 agouti: 5 white: 4 black • Q: Test the hypothesis that the original parental genotypes were BBCC and bbcc. Give the c2 value, the df, the P value, and state whether or not you reject the hypothesis.
Pedigrees-Review Not affected Affected Partly affected Female Male
Which is the pedigree of (1) autosomal dominant; (2) autosomal recessive; (3) sex-linked recessive?