Download
1 / 21
210 likes | 385 Vues
Kinetics of Promoter escape varies as a function of reaction Conditions. Sophiya Karki and Elina Shrestha Dr. Lilian Hsu, Biochem Dept. Summer Science Symposium 2007. Transcription Initiation and Promoter Escape. The escape rate for N25 >>N25 anti. Background. k E. K B. RPo.

E N D
Kinetics of Promoter escape varies as a function of reaction Conditions SophiyaKarki and ElinaShrestha Dr. Lilian Hsu, Biochem Dept. Summer Science Symposium 2007
Transcription Initiation and Promoter Escape The escape rate for N25 >>N25anti
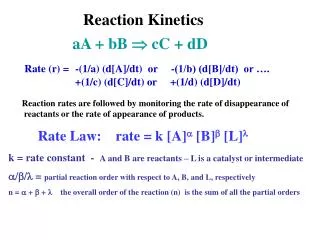
Background kE KB RPo EC +RNA k2 • R+P RPc • R : RNA Polymerase (RNAP) • P : Promoter DNA • RPc : RNAP-promoter closed complex • RPo : Productive RNAP-promoter open complex • RPo' : Unproductive RNAP-promoter open complex • EC : Elongation complex k-2 RPo’ Abortive transcripts Fig 1. Kinetic diagram of Transcription Initiation
Promoters Studied and Past Observation Up stream +20 +1 +3 G29 Transcription start site N25anti(-A) Promoter (Escape incompetent) GUCCGGCGUC CUCUUCCCGG UCCGUCUGGC UGGUUCUCGC A +20 +1 +3 C40 (Nwe-Nwe Aye-Han, 2007. Senior Thesis) N25anti promoter escapes 10 folds slower than N25 as indicated by the long escape half life but produces higher amounts of full length RNA. Initial Transcribed Sequences (ITS) N25(-C) Promoter (Escape competent) AUAAAUUUGA GAGAGGAGUU UAAAUAUGGC
Objectives kE KB k2 RPo EC +RNA k-2 Increasing productive RNA RPo’ Abortive transcripts A= The amount of full length RNA produced Hypothetical plot • To examine if the value of k-2is significant for N25 promoter R+P RPc To study the efficiency of promoter escape for N25 and N25anti promoter under various transcription conditions.
Experimental procedures N25(-C) Promoter AUAAAUUUGA GAGAGGAGUU UAAAUAUGGC • Making template for single cycle transcription RNAP N25anti(-A) Promoter GUCCGGCGUC CUCUUCCCGG UCCGUCUGGC UGGUUCUCGC A 3’deoxy CTP +1 G29 +1 C40
AUAAAUUUGA GAGAGGAGUUUAAAUAUGGC [α-32P] UTP labeled full length RNA Incubate A mix at 370C for 10 mins to form open complexes. Transfer the B mix into A mix. At each time points take 5ul aliquots of reaction mixture and add into 5ul FLB to terminate the reaction. 18 time points were taken. • Single cycle transcription (RNAP limiting condition)
Time course Transcription in 200mM KCl of N25 promoter Time Points 30’’ 1’ 1.5’ 2’ 2.5’ 3’ 3.5’ 4’ 4.5’ 5’ 7’ 10’ 15’ 20’ 30’40’60’90’ dilutions 1:30 1:90 1:270 1:810 1:2430 Full length RNA Abortive RNA
Postulated plot vs. Experimental plot Increasing productive RNA k-2 ? Hypothetical plot Experimental plot A= The amount of full length RNA produced Since the plateau level of productive RNA formed remains constant over time, we conclude that the value of k-2is negligible for N25 promoter.
Concentration of KCl as a Factor in Transcription Initiation and Promoter Escape • In steady-state transcription, high salt concentration (~200mM ) favors the formation of stable open complexes and so forth a high yield of full length RNA. • Optimal KCl concentration is different for different promoters. • For N25 it is 250mM • For N25anti it is 150mM Current interest : • Variation in escape rate and productive yield as a function of [KCl]. • Performed time-course transcription for four [KCL], 200mM, 100mM, 50mM and 10mM
Time course Transcription in 200mM KCl of N25 promoter Time Points 30’’ 1’ 1.5’ 2’ 2.5’ 3’ 3.5’ 4’ 4.5’ 5’ 7’ 10’ 15’ 20’ 30’40’60’90’ dilutions 1:30 1:90 1:270 1:810 1:2430 IQV Full length RNA Abortive RNA Radioactivity of the reaction mixture from full length RNA is counted by the scintillation counter in cpm (counts per minute) and the RNA bands are measured in Image Quant Volume (IQV) units.
Half Life of full length RNA produced in 200mM KCl= 4.0 mins y= A(1-e-kx)
Time course Transcription in 100mM KCl of N25 promoter Time pts. 30’’ 1’ 1.5’ 2’ 2.5’ 3’ 3.5’ 4’ 4.5’ 5’ 7’ 10’ 15’ 20’ 30’40’60’90’ dilutions 1:30 1:90 1:270 1:810 1:2430 Full length RNA Abortive RNA
Time course Transcription at 50mM KCl of N25 promoter 30’’ 1’ 1.5’ 2’ 2.5’ 3’ 3.5’ 4’ 4.5’ 5’ 7’ 10’ 15’ 20’ 30’ 40’ 60’ 90’ dilutions 1:30 1:90 1:270 1:810 1:2430 Full length RNA
Time course Transcription at 10mM KCl of N25 promoter 30’’ 1’ 1.5’ 2’ 2.5’ 3’ 3.5’ 4’ 4.5’ 5’ 7’ 10’ 15’ 20’ 30’ 40’ 60’ 90’ dilutions 1:30 1:90 1:270 1:810 1:2430 Full length RNA
N25 promoter Half life=0.9mins Amount of full length RNA produced in 100mM KCl =25.8 fmoles (<60 fmoles )
Half life = 0.5mins Amount of full length RNA produced in 50mM KCl =30.0 fmoles
Half life = 0.3mins Amount of full length RNA produced in 10mM KCl= 32.5 fmoles
Future Plans -Try different transcription conditions other than KCl concentration. For example, changing NTP concentration. -Further investigation is required to reach the conclusion.
Experimental Results Lower the concentration of KCl, faster is the escape and higher is the productive yield. This result was completely opposite to what was expected.
Acknowledgement Prof. Hsu Nwe-Nwe Aye-Han, ‘07 graduate and all other lab members Biochem dept. Mount Holyoke College